Blog • December 1, 2025 - Jaran Mellerud
When I first dove into bitcoin mining in 2020, I kept hearing about hashprice but struggled to grasp it. I knew it was important, so I made an effort to learn. Over time, I not only understood it but also learned to apply it in my calculations. Today, hashprice is essential to my financial analyses.
Mastering hashprice is key to understanding Bitcoin mining. We’ll explain what it is, break down its components, and walk through a real-world profitability example.
Hashprice is the only metric you need to calculate miner revenue. Forget everything else and focus on hashprice from now on. It consolidates all the factors affecting miner revenue into a single, powerful metric.
Hashprice can be expressed in USD and BTC, with USD being the most common. We’ll start with the BTC hashprice and then explain how to convert it to USD.
The BTC hashprice shows how much BTC a miner can expect to generate daily from continuously employing one PH/s of hashrate.
For example, if a large-scale miner uses 10,000 units of the WhatsMiner M63S, which individually generates 378 TH/s (0.378 PH/s), the total hashrate of his fleet is 3,780 PH/s. Today, the BTC-denominated hashprice is 0.00056658, which, multiplied by the total hashrate of 3,780 PH/s, equals a daily production of 2.14 BTC.
You can find this metric and the USD hashprice on Hashrate Index, which has tracked hashprice since 2020, providing valuable historical data for analysis.
Now that you understand how to use BTC hashprice and where to find it, the next question is: What factors determine BTC hashprice and, in turn, BTC-denominated miner revenue?
This data was previously publicly available on several FPPS pools' websites, but it now appears to have been removed for some reason. As a result, we will use this simplified formula instead.

As shown in the formula above, four factors determine the BTC hashprice:
1. Number of blocks per day: Fixed at 144 in Hashrate Index’s hashprice calculation, making it a constant component of the formula.
2. Block subsidy: Currently 3.125 BTC per block, halving every four years. It’s a fixed component, except during halving events.
3. Transaction fees: A portion of BTC revenue from mining, highly volatile but averaging 0.35 BTC per block since 2020.
4. Network hashrate: While it’s simplified here, the network hashrate (and associated mining difficulty) influences hashprice. As the network hashrate typically increases, the BTC hashprice tends to decrease.
We will now examine the historical BTC hashprice chart to gain a better understanding of how these factors influence the metric.
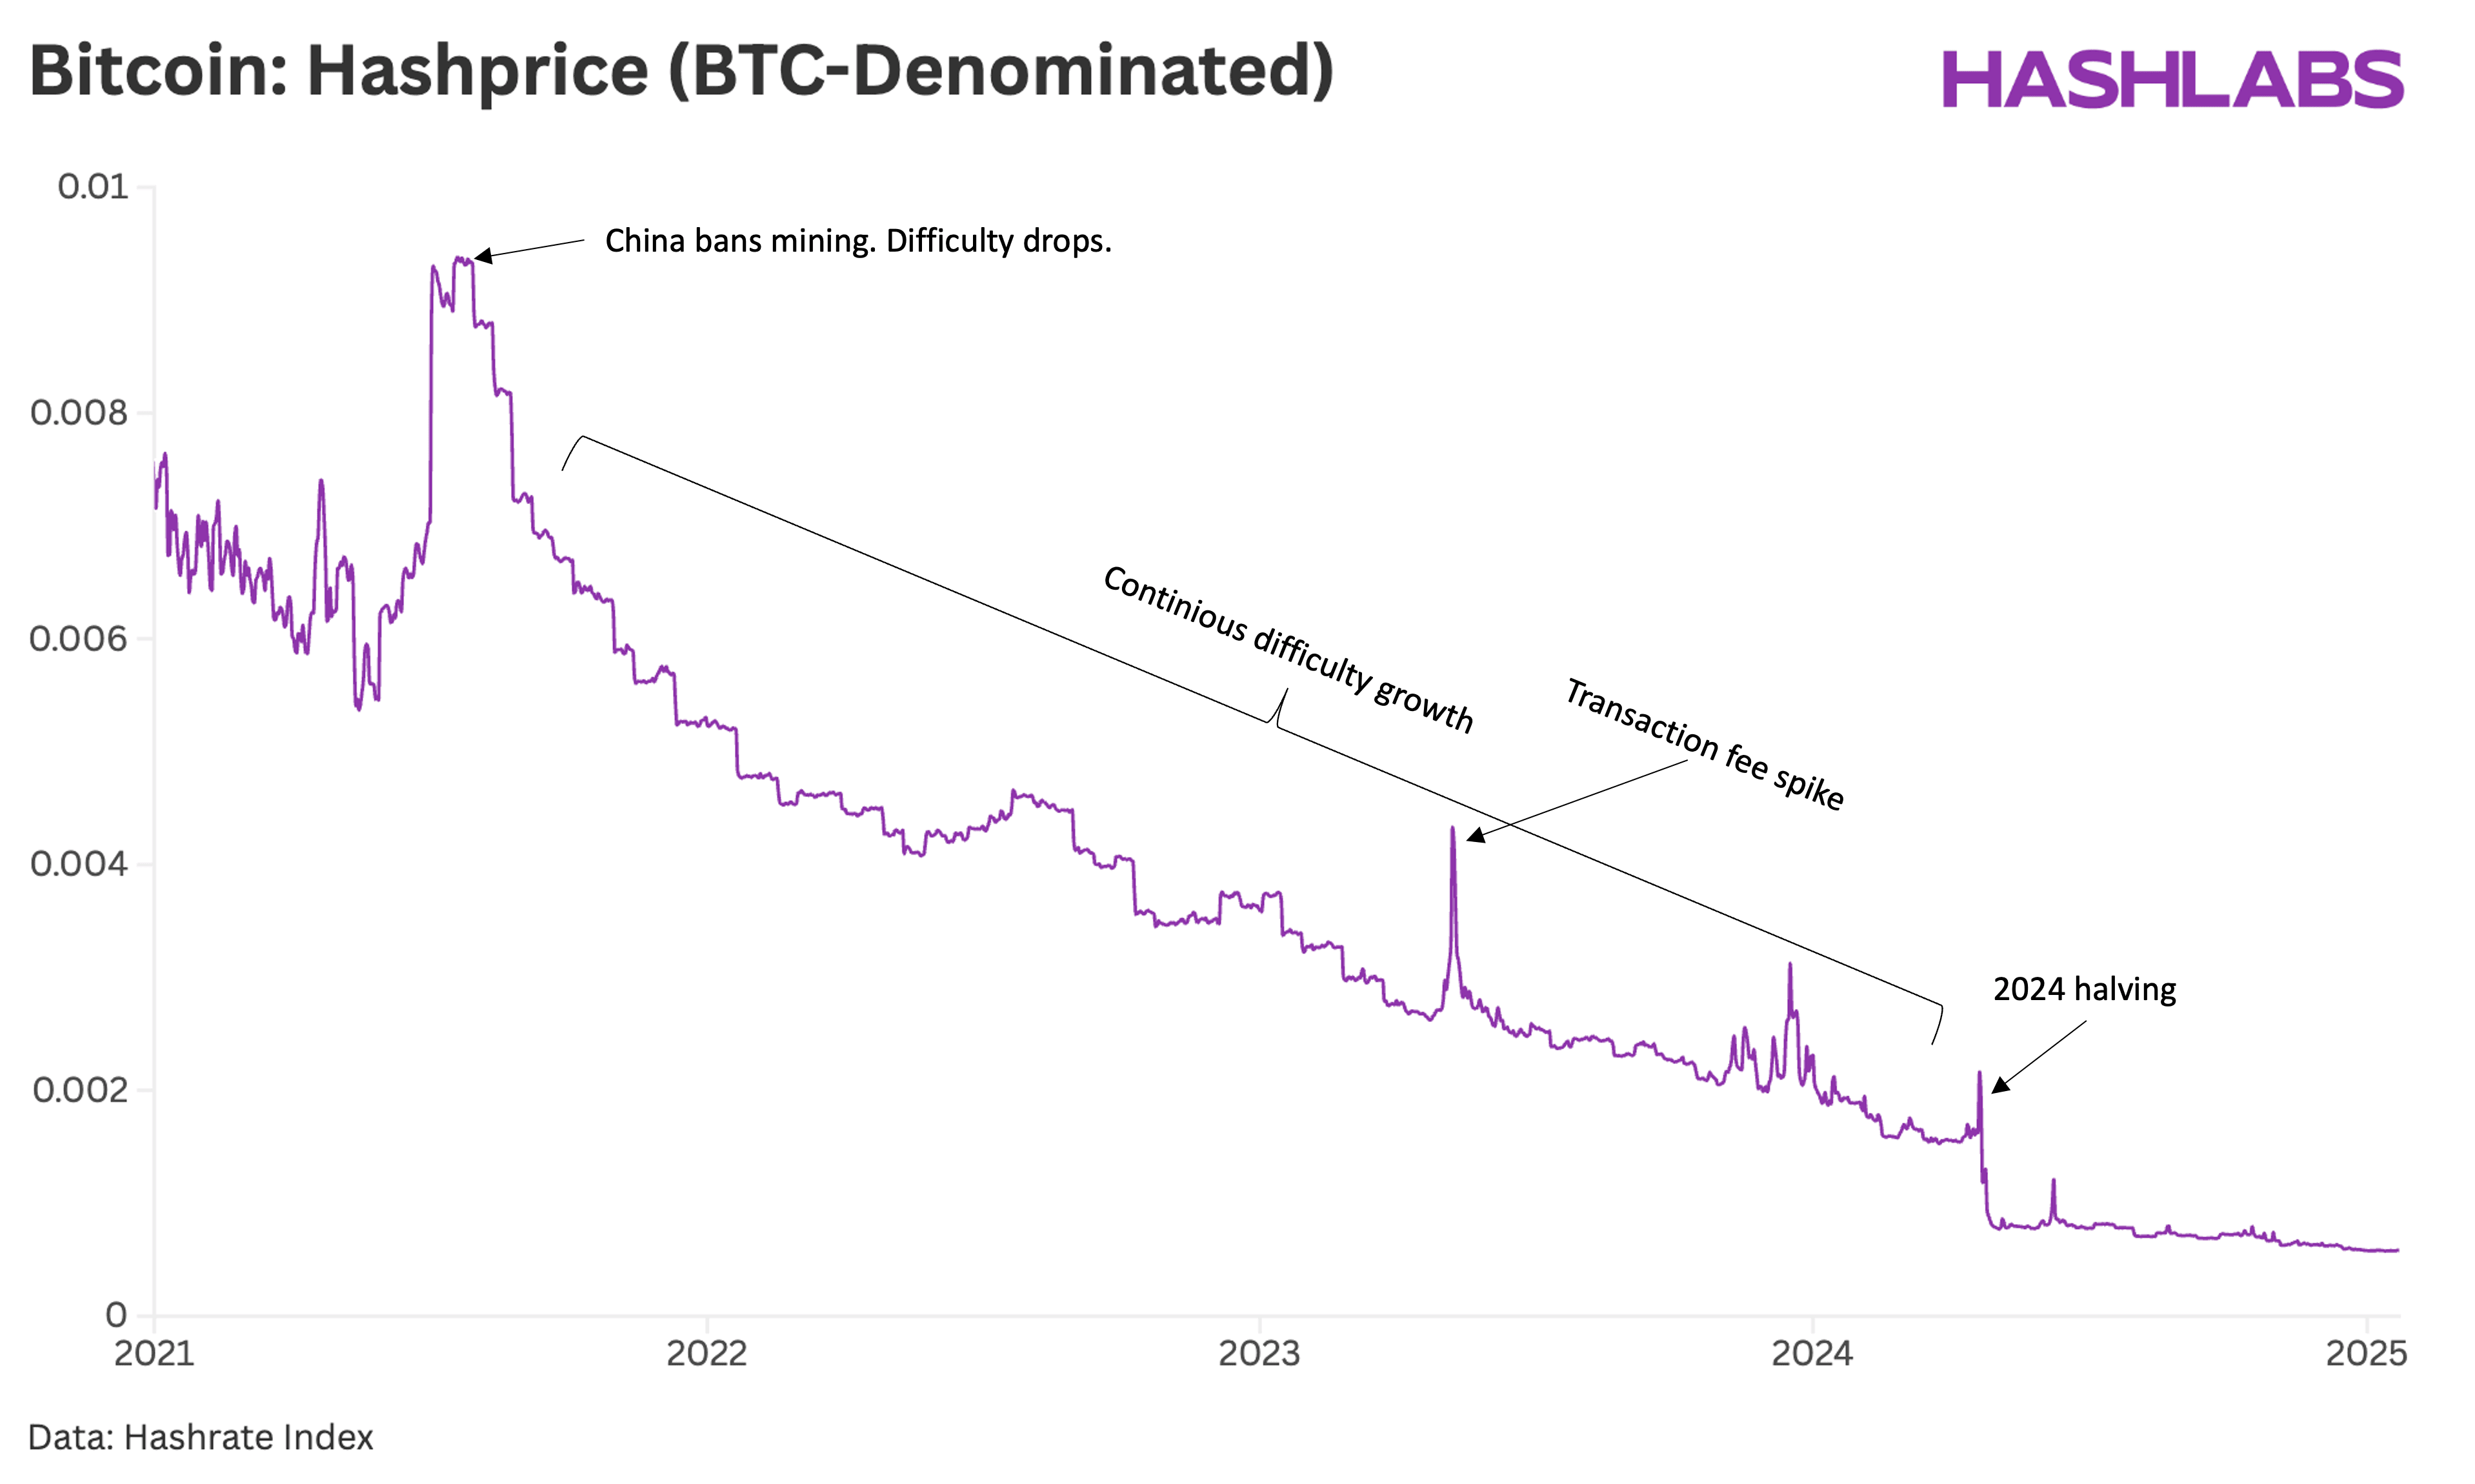
There are several key observations we can make from the chart above. Let’s break them down:
1. China’s mining ban in 2021: When China banned mining in mid-2021, the network hashrate dropped by nearly 50%. This caused a significant spike in BTC hashprice during the summer of 2021. With fewer miners, the network difficulty decreased, leading to more BTC revenue being distributed among those remaining miners. This was a profitable time for miners outside of China.
2. Continuous difficulty growth from late 2021 to 2025: Over this period, miners worldwide consistently added more hashrate, driven by better access to energy, capital, and more efficient machines. This ongoing increase in competition has put downward pressure on BTC hashprice and is expected to continue in the future. As I always say, the one certainty about network hashrate is that it will rise over the long term.
3. Transaction fee spike in 2023: Many miners overlook how transaction fees affect revenue, but there have been notable spikes in revenue due to sudden increases in transaction fees. The most significant spike occurred in 2023, causing a sharp rise in BTC hashprice over a short period.
4. 2024 halving: The 2024 halving saw a sharp decline in BTC hashprice as the block subsidy halved. The next halving is expected in 2028. While halvings will continue every four years, their effect on BTC hashprice will diminish over time, as transaction fees will contribute more to miner revenue.
The USD hashprice is determined by multiplying the BTC hashprice by the USD/BTC exchange rate. It reflects the expected daily revenue in USD per PH/s for miners. While the USD hashprice is influenced by the same factors as the BTC hashprice, it also depends on fluctuations in the USD/BTC exchange rate.
In traditional financial modelling, the USD hashprice is more relevant than the BTC hashprice.
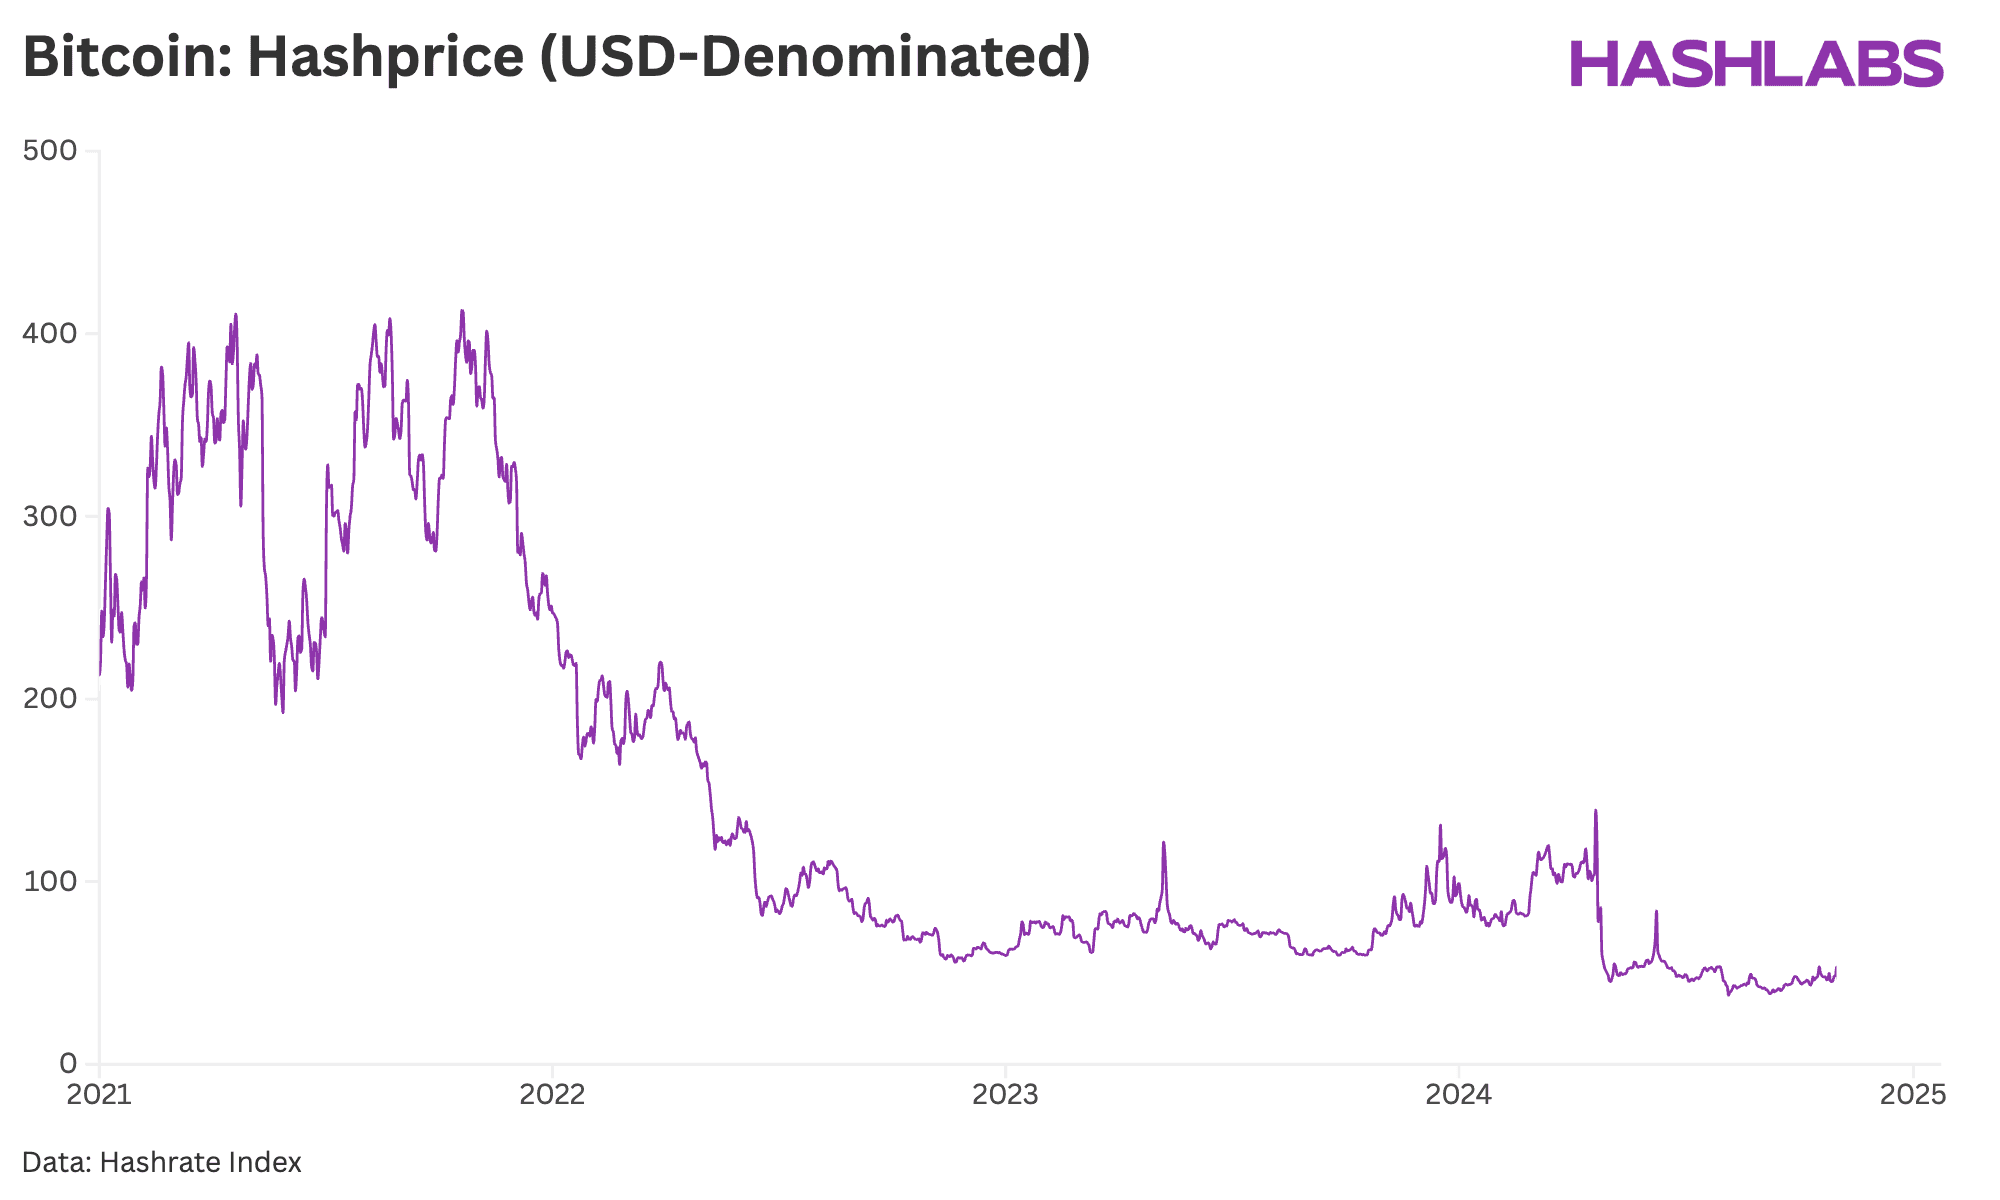
The chart above illustrates the evolution of the USD hashprice since 2021. Initially, it remained at elevated levels, ranging between $200 and $400 for most of that year. Referring back to the BTC hashprice chart earlier in the article, you’ll notice a similar trend—BTC hashprice was also high during this period due to the hashrate drop following China’s mining ban, which in turn drove up the USD hashprice.
Additionally, the USD hashprice was elevated in 2021 due to the high BTC price. As shown in the chart, the decline in BTC price throughout 2022 caused the USD hashprice to plummet. Since 2023, it has remained relatively stable, fluctuating between $40 and $129.
While predicting future hashprice movements is challenging due to its volatility, some trends are clear. The BTC hashprice will likely continue its long-term decline as network hashrate increases. However, the USD hashprice may be more stable over time, supported by the expected long-term appreciation of BTC.
Since the USD hashprice determines the entire revenue potential of a mining project, it is the biggest variable for future profitability. When doing a mining project, it is thus extremely important to know how changes in the hashprice will affect the profitability of your project, particularly if you take on debt to finance the project.
We will now demonstrate how different hashprices impact the profitability of mining projects. Since the primary goal of mining is to achieve a rapid return on investment, we will use the payback period as our key profitability metric.
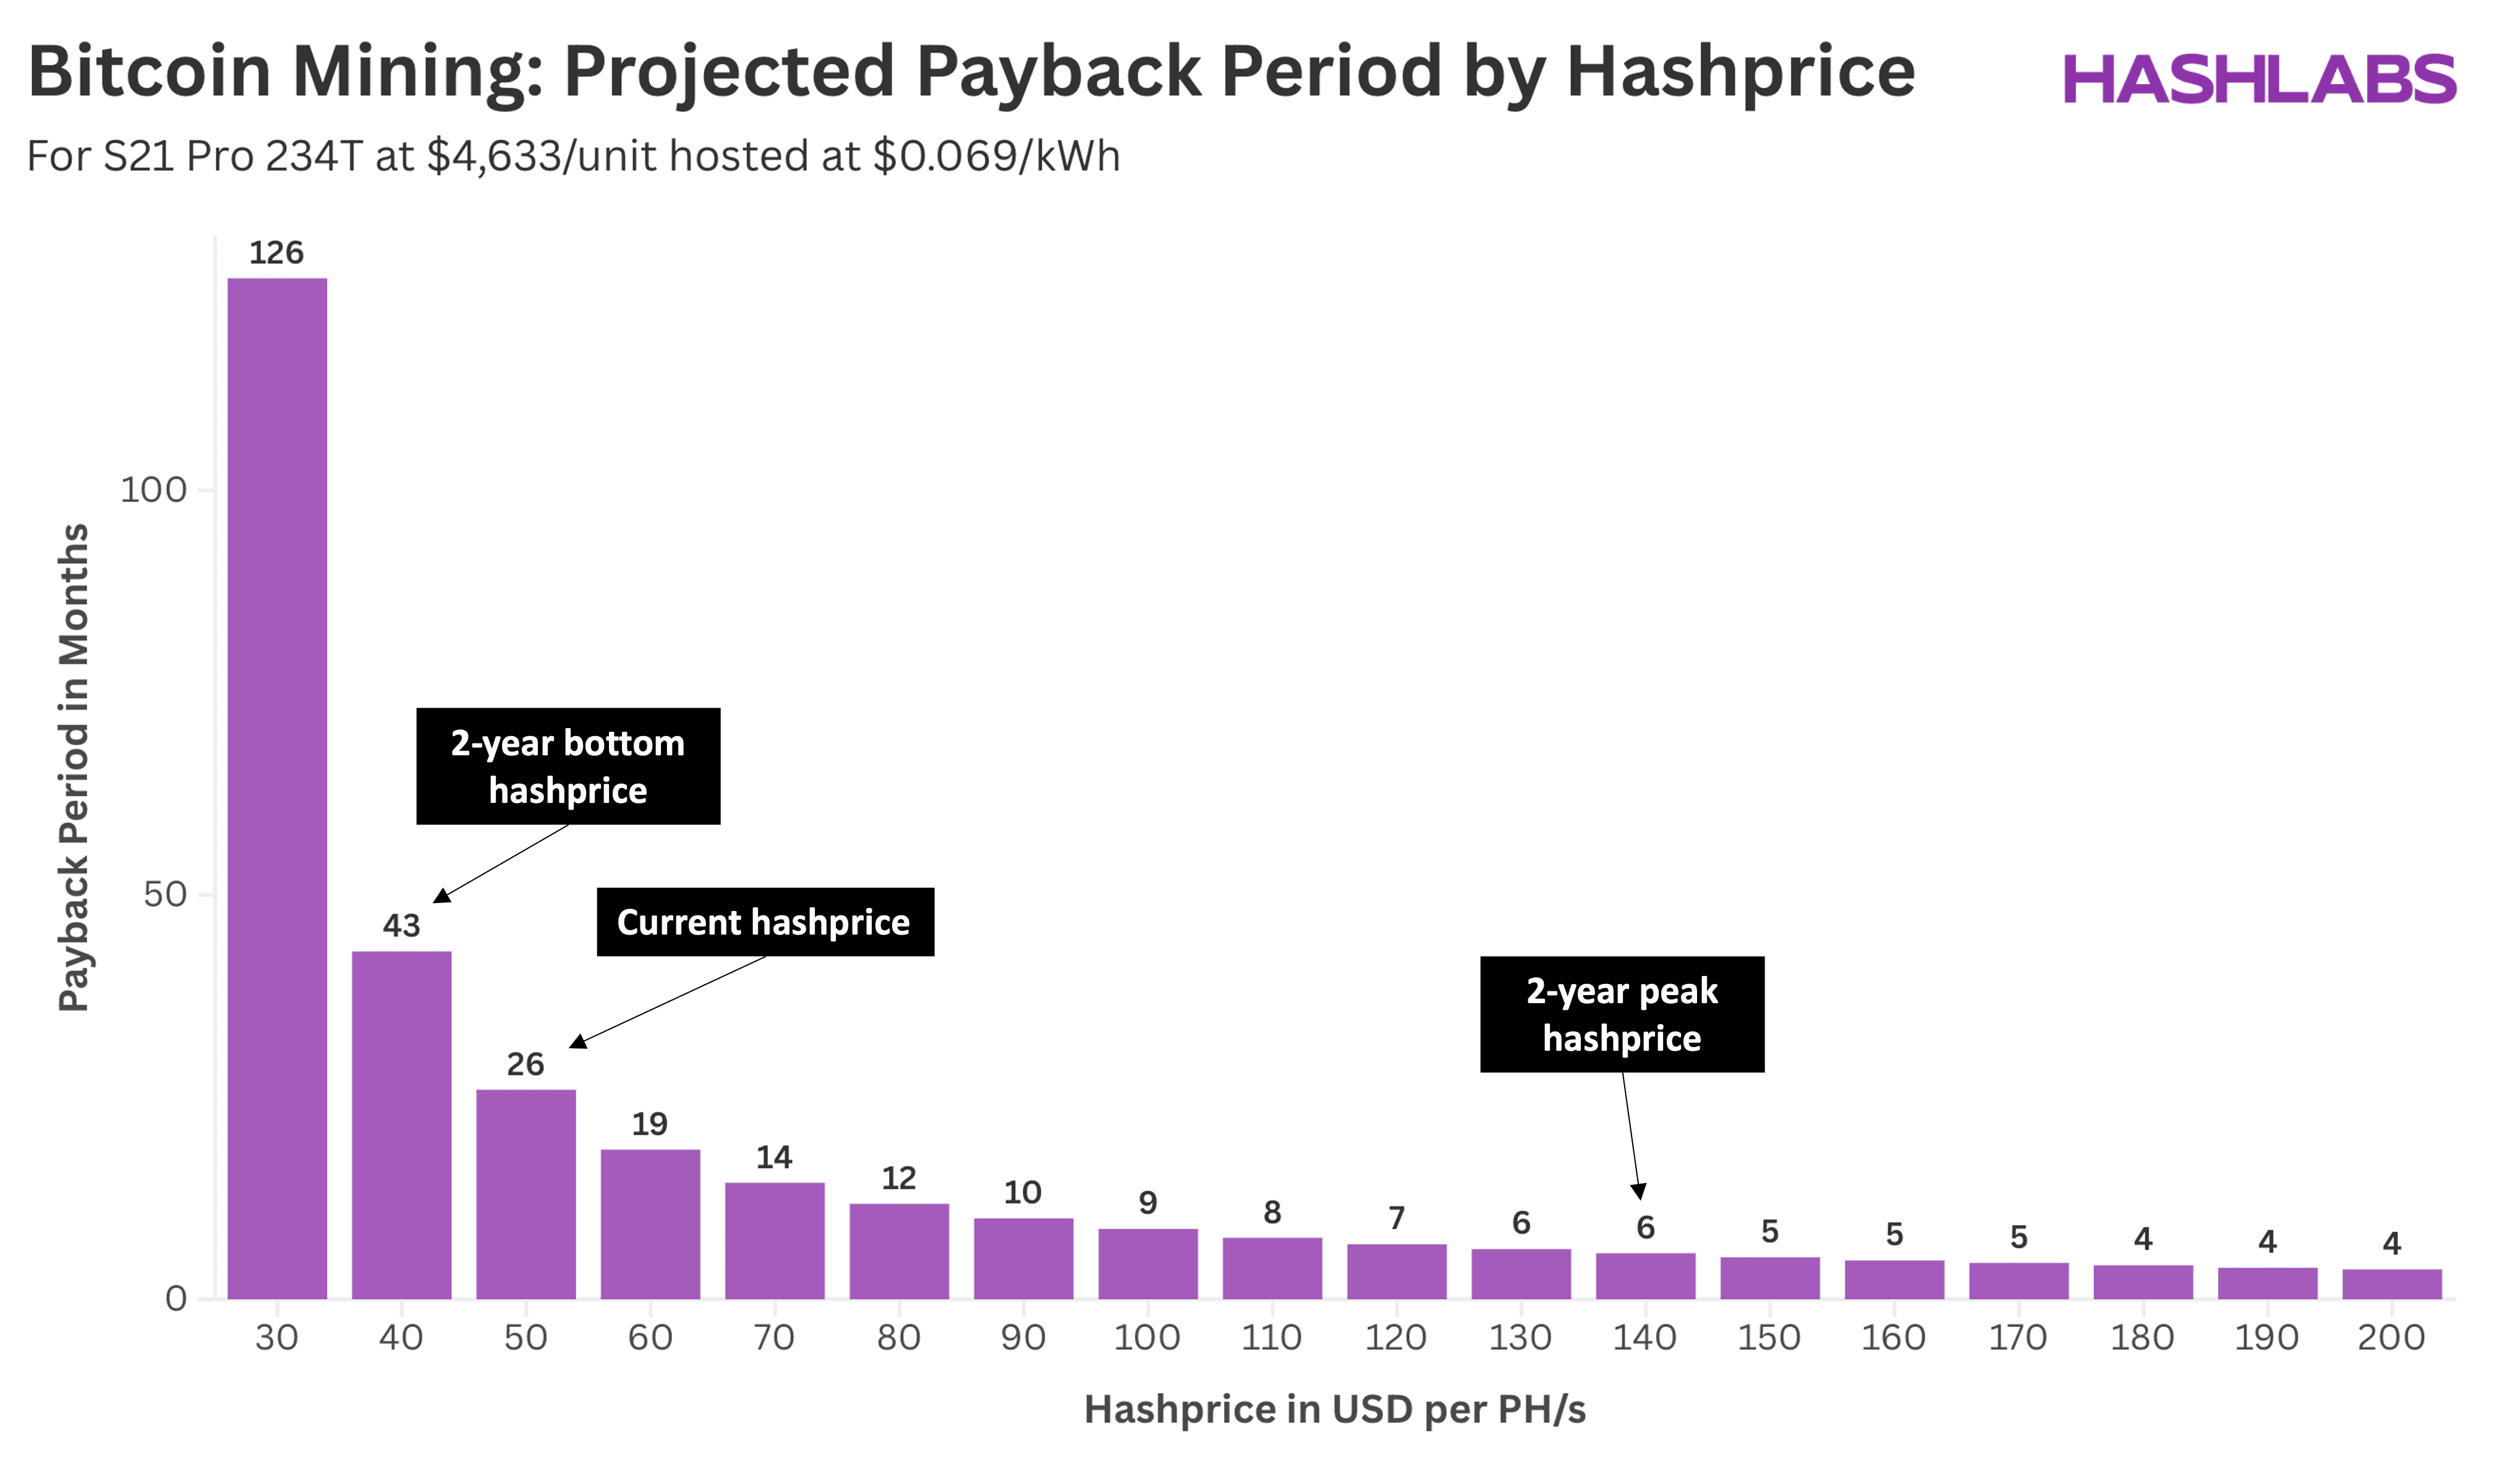
The chart above illustrates the projected payback period for an Antminer S21 Pro 234T, purchased at $4,633 per unit and hosted at $0.069/kWh (based on current Hashlabs prices).
As shown, the payback period varies significantly depending on the hashprice. At the current hashprice of $50, the payback period is 26 months—a reasonable but not exceptional return for mining. If the hashprice were to reach its two-year high of $139, the payback period would shrink to just 6 months. Conversely, at the two-year low of $40, the payback period extends to 43 months, making profitability much harder to achieve.
In a strong bull market, where hashprice rises sharply, mining investments can pay off within months. However, if market conditions deteriorate, miners may struggle to recover their costs.
At present, the hashprice is near its lowest level in the past two years. While we do not make predictions, there appears to be significant upside potential. As such, now could be an opportune time to expand mining capacity. It has historically been a good idea to add hashrate while the hashprice is at cyclical lows, as you can achieve a tremendous payback period when the hashprice eventually increases.
Understanding hashprice is crucial for making informed Bitcoin mining decisions. As we’ve demonstrated, hashprice directly impacts mining revenue and profitability, making it the single most important metric for miners to track. While market conditions fluctuate, having a deep understanding of hashprice trends helps miners navigate uncertainty and optimize their operations.
If you want to stay ahead in Bitcoin mining and gain expert insights like these, subscribe to our educational newsletter. Get the latest market trends, analysis, and strategies delivered straight to your inbox!