The Bitcoin Miner’s Dashboard: 6 Metrics That Explain Mining Profitability
The six most important Bitcoin mining metrics are hashprice, revenue per kWh, BTC price, mining difficulty, global hashrate, and fees per block. Hashprice shows what miners earn per unit of hashrate, while revenue per kWh shows whether that revenue is enough to cover electricity or hosting costs.
Bitcoin miners do not make decisions based on BTC price alone.
Mining profitability is shaped by several moving parts at once: block rewards, transaction fees, mining difficulty, global hashrate, power costs, and machine efficiency.
That is why at Hashlabs, we track a focused set of Bitcoin mining metrics every day. Together, they show whether mining conditions are improving, tightening, or entering a stress period.
The metrics we outline in this article are specifically focused on the revenue side of mining, as the cost side is usually somewhat fixed.
You can track these metrics live in the Hashlabs Terminal, which combines Bitcoin mining market data, a mining machine database, and a simple ROI calculator for investors.
Bitcoin mining metrics at a glance
| Metric | What it measures | Why miners watch it |
|---|---|---|
| Hashprice | Daily revenue per unit of hashrate | Shows what hashrate is worth |
| Revenue per kWh | Mining revenue per unit of electricity | Helps compare revenue with power or hosting costs |
| BTC price | Market value of mined bitcoin | Drives the USD value of miner revenue |
| Mining difficulty | How hard it is to mine a valid block | Determines how much BTC a fixed amount of hashrate earns |
| Global hashrate | Estimated total computing power on the Bitcoin network | Shows the scale of mining competition |
| Fees per block | Transaction fees paid to miners | Adds variable revenue on top of the block subsidy |
The best way to understand mining profitability is to start with hashprice, then translate it into electricity economics through revenue per kWh. The other metrics explain why those numbers are moving.
Metric 1: Hashprice - the Godfather of mining metrics
Hashprice is the king of Bitcoin mining metrics. If there is only one number you should monitor, it is hashprice.
Hashprice shows the daily revenue generated per unit of hashrate. The standard unit is USD per PH/s per day, but it can also be shown in BTC per PH/s per day.
BTC price tells you what bitcoin is worth. Hashprice tells you what hashrate is worth.
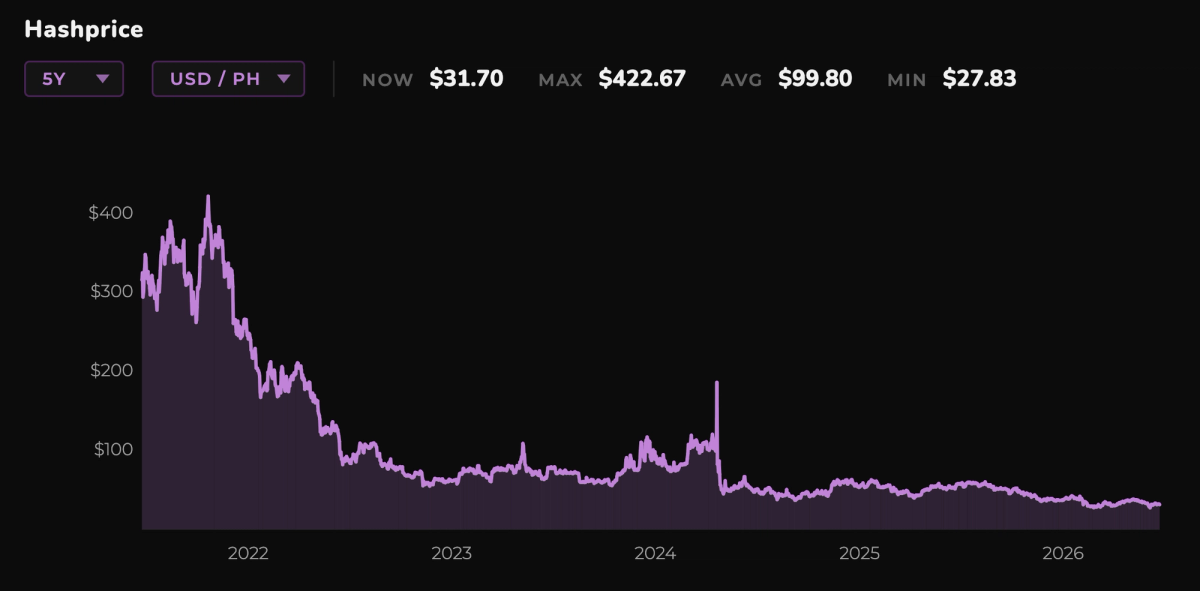
The USD-denominated hashprice chart from the Hashlabs Terminal shows how much revenue miners earn per unit of hashrate. Hashprice has trended downward since the mining bull market in 2021 and has dropped further in 2026. It is currently close to all-time lows.
This matters because hashprice translates the entire mining market into one number. When hashprice rises, the same machines earn more. When hashprice falls, the same machines earn less.
In the Hashlabs Terminal, hashprice is one of the first metrics shown because it is the fastest way to understand Bitcoin mining revenue.
Hashprice calculation, simplified
BTC-denominated hashprice is driven by three main inputs:
Mining difficulty
Block subsidy
Average transaction fees per block
USD-denominated hashprice is then calculated by converting that BTC revenue into dollars:
USD hashprice = BTC hashprice × BTC price
For example, if BTC hashprice is 0.000506 BTC per PH/s per day and BTC trades at $62,500, then USD hashprice is:
0.000506 × $62,500 = $31.63 per PH/s per day
This is why BTC-denominated and USD-denominated hashprice charts tell different stories. BTC hashprice shows how much bitcoin one unit of hashrate earns. USD hashprice shows what that bitcoin revenue is worth in dollar terms.
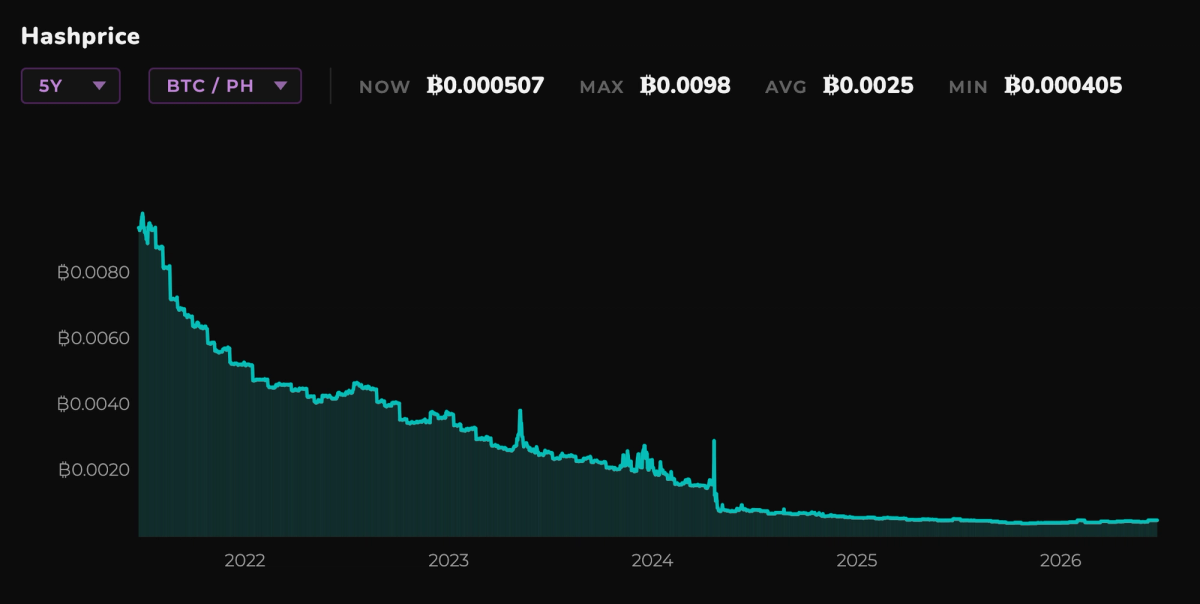
The BTC-denominated hashprice chart tells a more structural story. Over time, miners should expect to mine less bitcoin for the same amount of hashrate because of halvings and rising difficulty.
That is why USD-denominated hashprice is usually the more important version for operators and investors. Most miners pay for electricity, hosting, payroll, infrastructure, and debt service in USD or other fiat currencies.
Example: calculating mining revenue from hashprice
Once you know the USD hashprice, calculating gross mining revenue is simple:
Daily mining revenue = miner hashrate × USD hashprice
If you operate 10 Antminer S21 Pro machines at 234 TH/s each, your total hashrate is:
10 × 234 TH/s = 2,340 TH/s = 2.34 PH/s
With a USD hashprice of $31.64 per PH/s per day, your miners would generate:
2.34 PH/s × $31.64 = $74.04 per day in gross revenue
This is why hashprice is so useful. It lets you quickly translate market conditions into expected revenue for any mining fleet.
If you want to explore the economics of this particular miner model further, you can do so at its dedicated page in the Hashlabs Terminal.
Metric 2: Revenue per kWh
After hashprice, the second-most important Bitcoin mining metric is revenue per kWh.
Bitcoin mining machines convert electricity into bitcoin revenue. Revenue per kWh shows how much USD revenue miners generate for each kilowatt-hour of electricity consumed.
Hashprice tells you what your hashrate is worth. Revenue per kWh tells you whether that revenue is enough to cover your power cost.
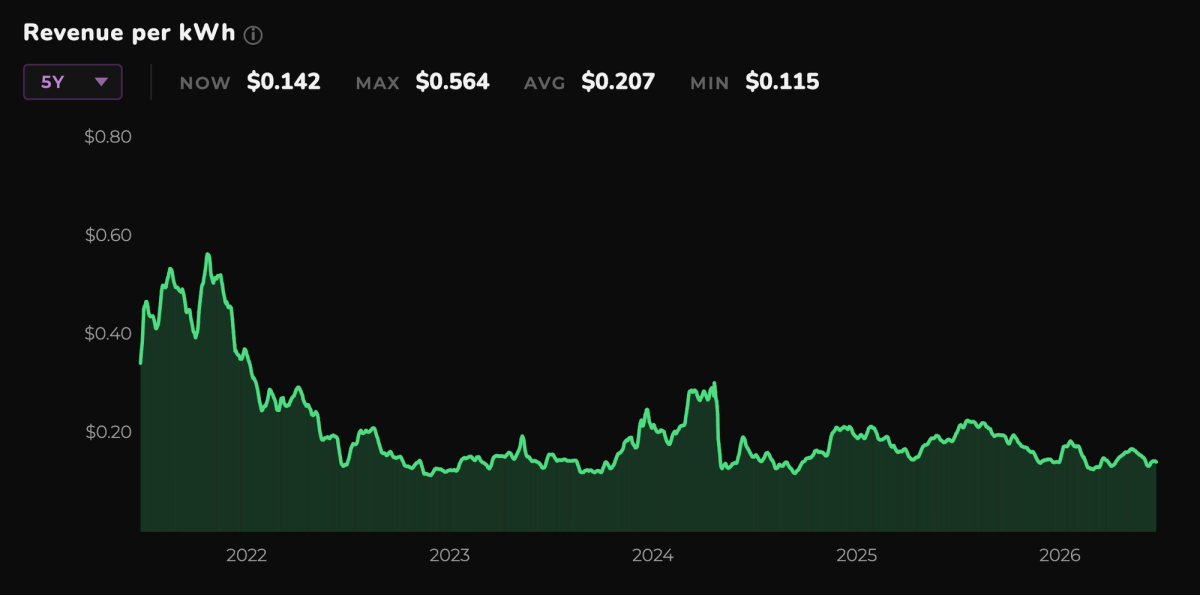
The revenue per kWh chart from the Hashlabs Terminal shows the highest available revenue per kWh based on the most efficient miner available at each point in time.
Revenue per kWh was extremely high during the 2021 mining bull market. Since then, it has generally been more stable, often ranging between $0.15 and $0.20. It is currently around $0.142, which is close to the lowest levels seen in recent years.
This metric matters because it connects mining revenue directly to the miner’s electricity bill.
If your hosting rate is far below revenue per kWh, your machines have a healthy gross margin. If your hosting rate is close to revenue per kWh, your margin is thin. If your hosting rate is above revenue per kWh, you are likely mining at a gross loss before other costs.
Revenue per kWh also differs by miner model. A highly efficient machine generates more hashrate per unit of electricity consumed, which means it earns more revenue per kWh than an older, less efficient machine.
On the Hashlabs Miners page, you can compare Bitcoin mining machines by efficiency, hashrate, power consumption, revenue, gross profit, gross margin, and revenue per kWh.
After choosing a machine, investors can use the Hashlabs ROI calculator to estimate revenue, electricity costs, gross profit, payback period, and projected resale value.
Metric 3: BTC price
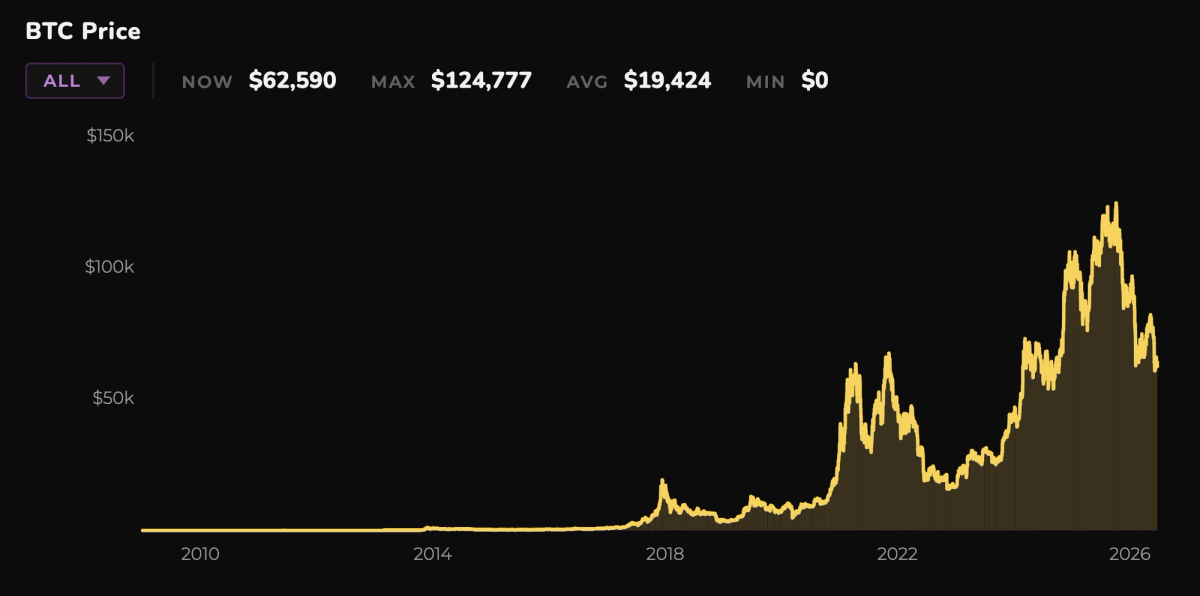
BTC price is the most visible mining metric. Everyone pays attention to it.
For miners, BTC price matters because mining revenue is earned in bitcoin while most costs are paid in fiat. When BTC price rises, the dollar value of miner revenue increases. When BTC price falls, the dollar value of miner revenue declines.
But BTC price alone can be misleading.
BTC price is only one of the factors making up hashprice. The others are mining difficulty, block subsidy, and transaction fees.
If bitcoin rises but difficulty rises even faster, miners may not see much improvement in hashprice. If bitcoin is flat but transaction fees spike, miners can temporarily earn more. If bitcoin falls but difficulty also falls, the revenue decline can be partially offset.
That is why miners should watch BTC price together with hashprice, difficulty, and fees.
Metric 4: Mining difficulty
Mining difficulty is the biggest enemy of all miners. The higher the difficulty, the smaller the share of the block reward pie your hashrate can capture.
Difficulty adjusts roughly every 2,016 blocks to keep the average Bitcoin block time close to 10 minutes. When more hashrate comes online, difficulty increases. When hashrate leaves the network, difficulty decreases.
Higher difficulty means the same hashrate earns less BTC. Lower difficulty means the same hashrate earns more BTC.
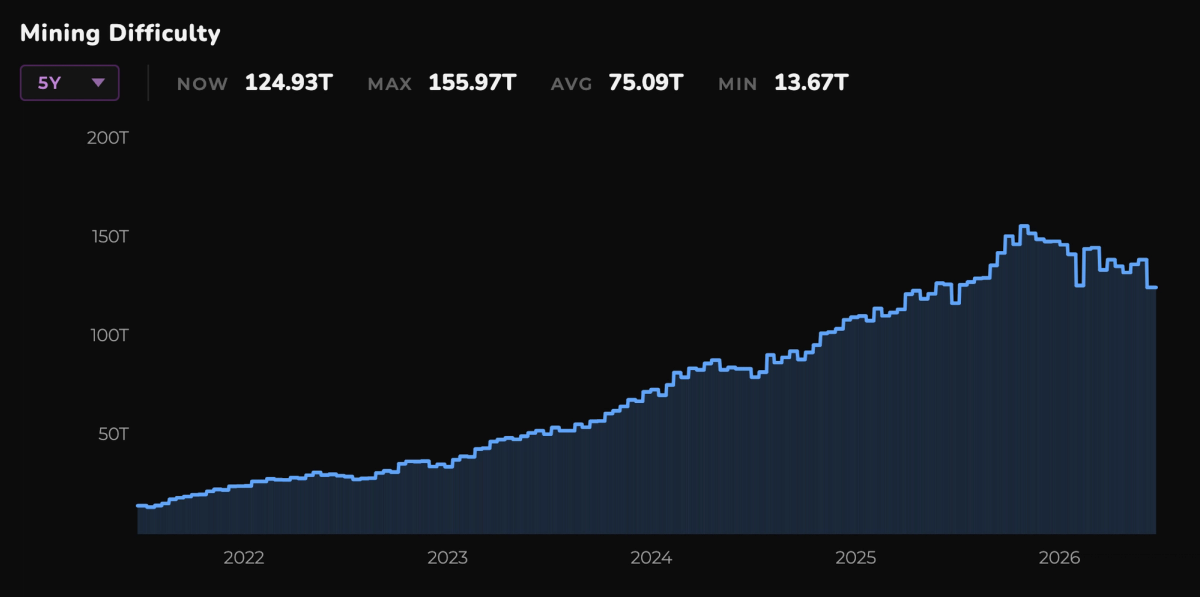
The mining difficulty chart from the Hashlabs Terminal shows how competitive Bitcoin mining has become over time. Difficulty has grown significantly as more efficient miners have come online.
However, since October 2025, weaker mining economics have led to a meaningful decline in difficulty. High-cost miners have gone offline, and some large energy and data center sites have shifted focus toward AI and high-performance computing.
This decline is welcomed by miners who remain online. When difficulty falls, surviving miners earn a larger share of the block rewards.
If BTC price recovers while difficulty remains slow to rebound, miners could enter a more profitable period. That is one reason why the current part of the cycle could be interesting for miners with efficient machines and low-cost power.
Metric 5: Global hashrate
Global hashrate measures the total computing power securing the Bitcoin network. It is usually expressed in exahashes per second, or EH/s.
The global hashrate is not directly known. It is estimated from Bitcoin’s block production rate and mining difficulty.
Hashrate is less important to follow than difficulty because difficulty is the metric that directly impacts hashprice. Still, hashrate is useful because it shows the overall scale of the Bitcoin mining network.
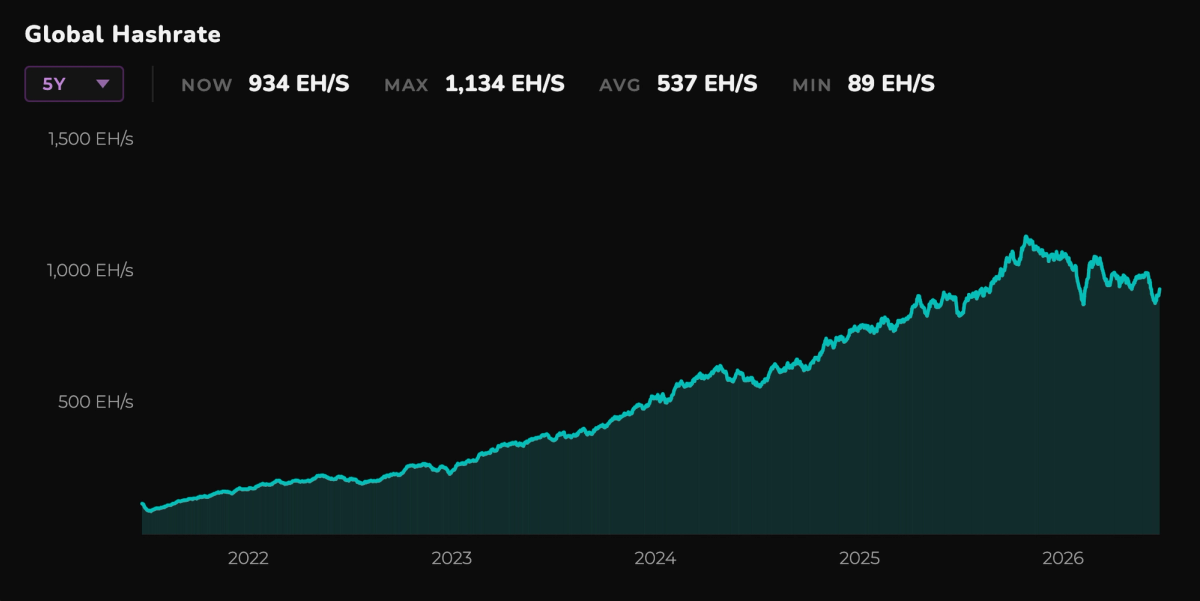
The global hashrate chart shows that Bitcoin mining has scaled massively over the past five years.
Hashrate and difficulty tend to move together. More hashrate generally leads to higher difficulty. Lower hashrate generally leads to lower difficulty.
The difference is that difficulty is set by the Bitcoin protocol, while hashrate is estimated.
In simple terms: difficulty tells you how hard the race is. Hashrate tells you how many machines are running the race.
Metric 6: Fees per block
Fees per block are often forgotten because they have been very low over the past couple of years. Most of the time, the block subsidy makes up the majority of miner revenue.
But fees still matter.
Miners earn transaction fees in addition to the block subsidy. Unlike the subsidy, fees are not fixed. They are determined by demand for Bitcoin block space.
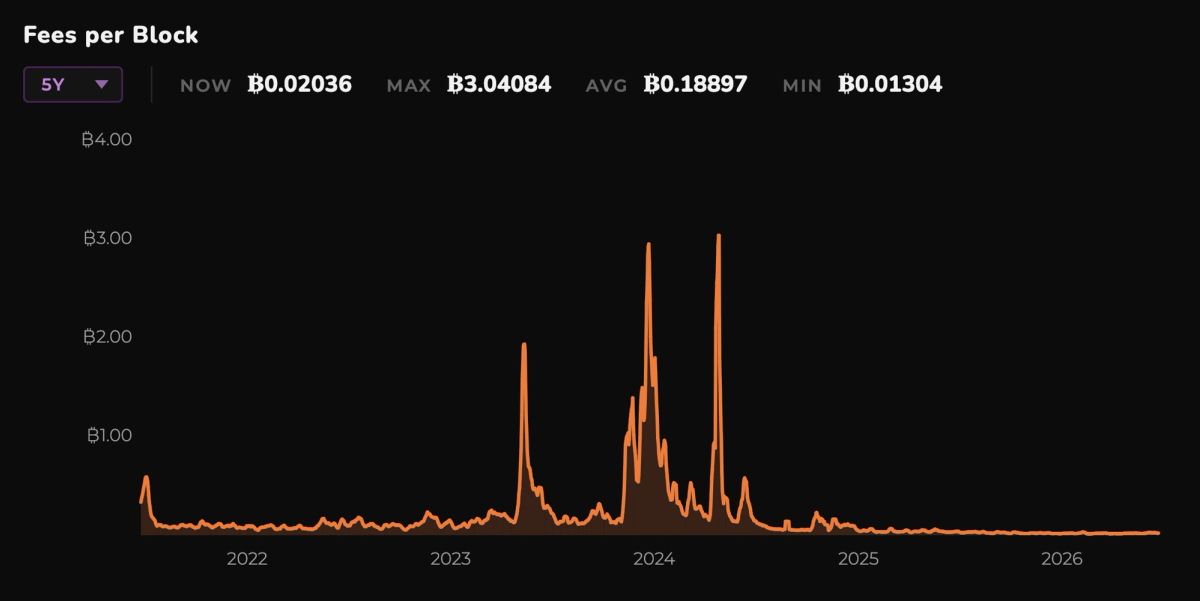
Fees per block are currently very low at around 0.02 BTC per block, so they are not providing a major boost to miner revenue.
However, fees can be extremely volatile. During periods of high transaction demand, fees can spike to several bitcoin per block. We last saw such periods in 2024.
This makes fees difficult to model. If you only use current fees, you may underestimate long-term revenue during fee spikes. If you assume large fee spikes all the time, you will overestimate revenue.
We have written a deeper analysis of this in Don’t Forget the Transaction Fees, where we show how Bitcoin transaction fees can periodically surge and materially improve miner revenue.
The main takeaway is simple: fees are usually small, but when they spike, they immediately increase hashprice.
How these Bitcoin mining metrics work together
No single chart explains Bitcoin mining profitability.
Hashprice shows what hashrate earns. Revenue per kWh shows whether that revenue covers power costs. BTC price shows the market value of mined bitcoin. Difficulty shows the level of competition. Global hashrate shows the scale of the network. Fees per block show the variable revenue upside.
The most important insights come from watching how these metrics interact and combine into the single most important metric - hashprice.
A BTC price increase can be offset by rising difficulty. A weak BTC price can be partially offset by falling difficulty. Low fees can suppress hashprice, while sudden fee spikes can give miners a temporary revenue boost.
Revenue per kWh then translates all of this into the practical question every miner cares about: is my electricity price low enough?
For investors evaluating a specific mining deal, these metrics should also be combined with payback period, cost-to-revenue ratio, and other considerations. We cover that in our complete framework for evaluating Bitcoin mining investments.
What the current Hashlabs Terminal charts show
The current Hashlabs Terminal charts show a tight Bitcoin mining environment.
Hashprice is close to its recent lows, meaning each unit of hashrate earns less than it did during stronger mining market periods. Revenue per kWh has also compressed, making electricity costs and machine efficiency more important.
Fees per block are currently low, so transaction fees are not providing a major revenue boost. Difficulty and hashrate have declined from their peaks, but competition remains high compared with previous years.
The result is a market where disciplined capital allocation matters. Efficient machines, low-cost power, and realistic ROI assumptions are more important than ever.
That is exactly what the Hashlabs Bitcoin mining ROI calculator is built to help investors estimate.
Track Bitcoin mining metrics with the Hashlabs Terminal
The Hashlabs Terminal brings the most important Bitcoin mining metrics into one place.
Investors can track live hashprice, revenue per kWh, BTC price, fees per block, global hashrate, and mining difficulty. They can also compare mining machines by efficiency, gross margin, and revenue per kWh, then estimate mining profitability with a simple ROI calculator.
For miners and investors, the goal is simple: understand the mining market before making decisions.
Explore the Hashlabs Terminal to monitor Bitcoin mining economics, compare machines, and estimate returns before committing capital.