.png)
Podcast
&
January 22, 2026
As Bitcoin is approaching the middle of the current cycle, the continuous deployment of new megawatts coupled with cumulative efficiency gains has fueled the hashrate rally above the Zetahash level, ending 2025 at 1 056 EH.
While most public entities are now eyeing on HPC deals to maximize their revenue per MW, the hashrate surged sharply in the second half of 2025. A rise exacerbating a downward pressure on hashprice, despite Bitcoin brief uptick to a new ATH at $125K.
Two opposing factors are now shaping the future of hashrate: the HPC pivot and the acceleration of ASIC innovation cycles. Chiefly, these structural dynamics lie at the core of our end-of-year (EOY) hashrate outlook.
Hashrate Forecast
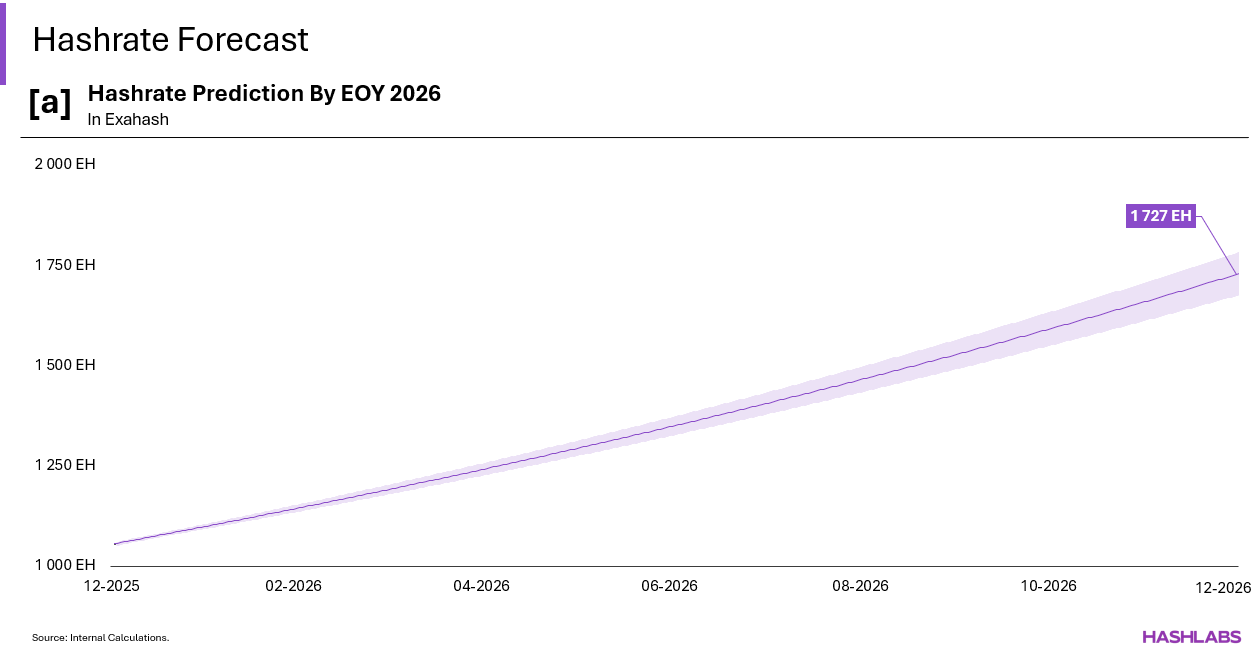
Combining our three modelling approaches, we estimate that global hashrate could culminate at 1 727 EH by the end of 2026 - ranging from 1 677 EH to 1 777 EH - a 63.6% jump from the end-of-year 2025 level, marking a new all-time-high in bitcoin security.
Despite the anticipated reallocation of megawatts from BTC mining towards HPC, the hashrate growth is not going to lose its momentum. Efficiency gain is the primary driver of this sustained hashrate uptick. At the same time, the machine prices downtrend should continue as new manufacturers will fuel the ASIC supply – Bitdeer, Proto, Auradine – eventually enabling miners to deploy more hashrate at the same level of capital.
Public companies vs Total Hashrate
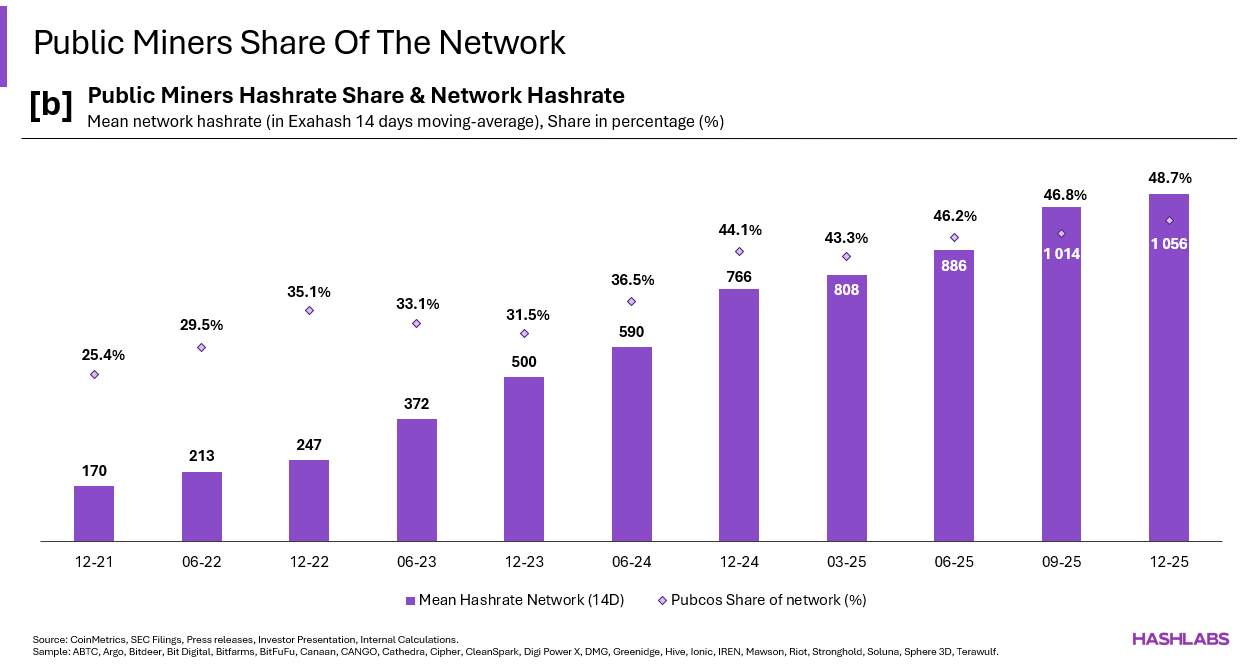
Tracking the hashrate of public miners since December 2021, their share of the total network gradually increased, hitting an ATH of 48.7% in December 2025, nearly doubling from 25.4% at the end of 2021. Notably, this growth was largely driven by the rising concentration of U.S.-based miners, supported by their easier access to capital markets.
Caveats must be noted: data from BitFuFu, Ionic Digital (incoming IPO), Canaan & Cango were only included in the sample when publicly disclosed. BitFuFu entered the sample in Q1-24 with 28.6 EH, Ionic in Q3-24 with 9.4 EH, and Canaan & CANGO in Q4-24 respectively with 5.0 and 32.0 EH. Including those miners creates artificial boosts in the estimated public hashrate share, as a portion of this hashrate already existed and simply transitioned from a private to a public status.
Sensitivity Analysis
Using sensitivity tables we can explore the impact of a change in network conditions and market variables on mining profitability. Critically, after forecasting the network hashrate, we can extrapolate the implied hashprice under varying Bitcoin price assumptions.
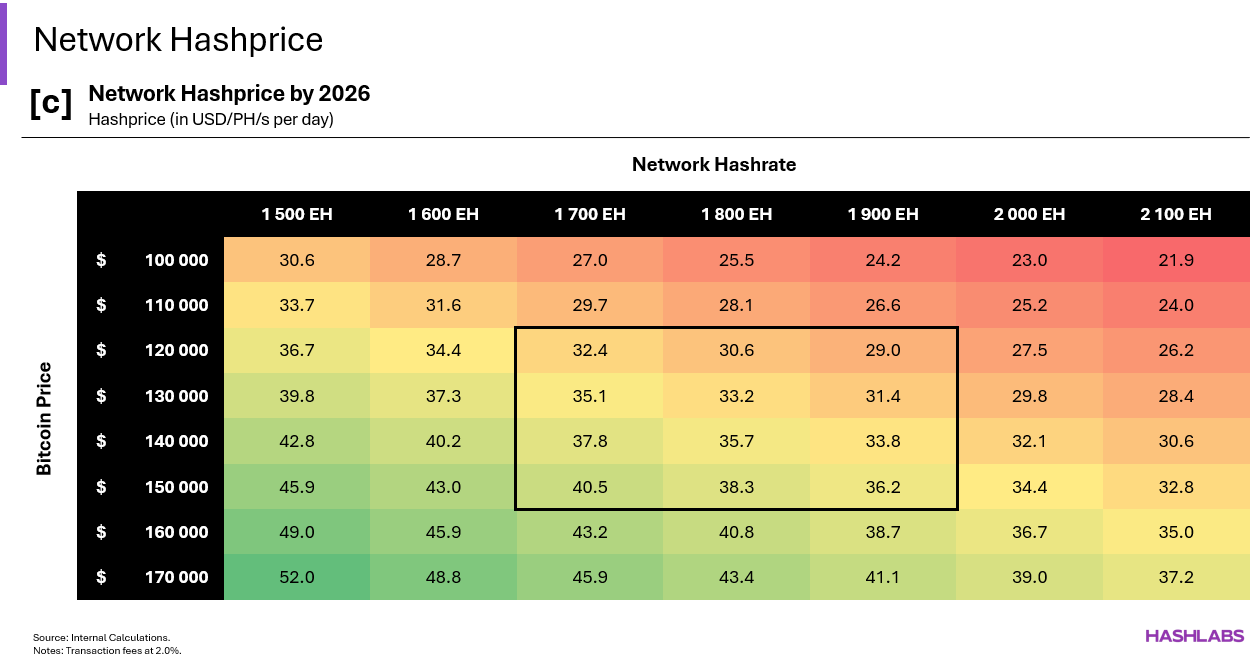
Below, the table shows the hashprice assuming transaction fees account for 2.0% of total block rewards. Under a base case where Bitcoin trades between $120 000 and $150 000 and the network hashrate terminates the year between 1 700 and 1 900 EH, the implied mean hashprice is approximately $34.5/PH/s.
In a worst-case scenario, where bitcoin drops at $100,000 and hashrate mounts at 2 000 EH, hashprice could slump at $23.0/PH/s. However, this situation would imply a 17.4 J/TH network efficiency – power cost at $55/MWh and machine duration at 48 months – to run profitably and ignoring any capex cost in the implied breakeven hashcost calculations.
From a profitability standpoint, assuming a mean hashcost at $25.2/PH/s3, holding previous network and market conditions constant, the gross margin stabilize within a 60.7% - 15.0% range, maintaining correct to thin margins ahead of the 5th halving.
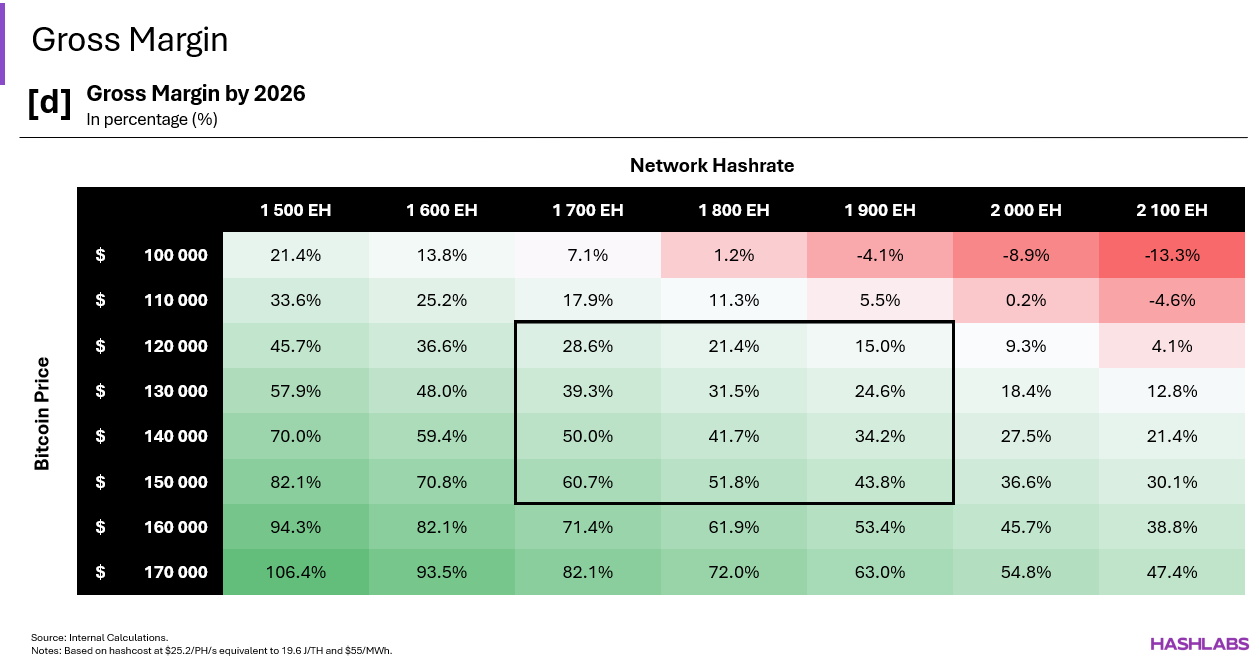
Looking forwards, however, those financials will inevitably erode, particularly if the bitcoin price and transaction fees stagnate or wind down. In a severe margin contraction scenario, the hashrate outlook can vary considerably, as miners would be forced to curtail or plug off inefficient machines due to unprofitability.
Hashrate Forecast Break Down
To derive our hashrate estimate for the end of 2026, we conceived three models.

This method relies on historical public miners data, especially their hashrate target and the pipeline of megawatts allocated to their bitcoin mining segment to project what could be their future share of the network.
Similar to the previous method, it uses public miners data to estimate the megawatts currently active on the network and how many gigawatts will come online from both public and private companies.
This approach evaluates the amount of profitable computing power theoretically deployed over the network based on a set of variables: BTC price, power cost, payback period and the CAPEX cost for machines (in $/TH).
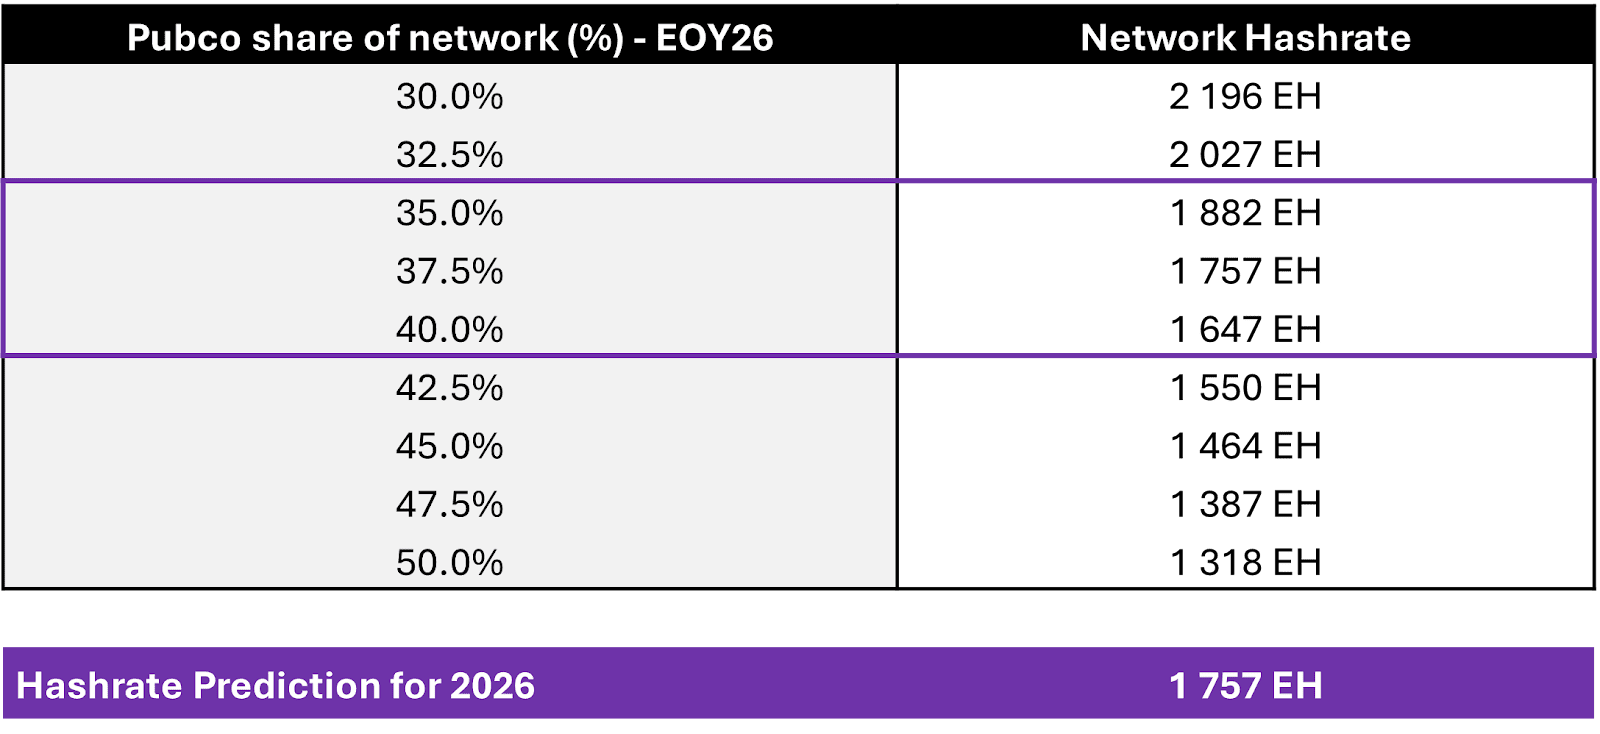
Method 1: Future Share of Public Miners As a Proxy for Network Hashrate
Our analysis outlines a projected network hashrate at 1 757 EH, surging by +66.4% from 1 056 EH at current level2.
Over 2025 our public miner sample averaged a 46.2% share of the total network. Peaking at 48.7% in December 2025, it marks an ATH over the period studied above (from Dec-21 to Dec-25).
However, given the current euphoria surrounding HPC and the substantial capital inflows required, it is highly probable that public miners’ market share will retrace from its recent spike. We anticipate a pullback at approximately 37.5% of the total network hashrate, as many of the miners currently retrofitting their data centers are the same entities that have historically dominated the hashrate mix since the 2020 China ban.
Based on public miners’ disclosed hashrate targets, energy pipeline, and machines available on the market, we assessed that public miners compute power could reach 659 EH by December 2026. At 37.5% share of the market it implies a total network hashrate of 1 757 EH, underpinning a spectacular shift in momentum towards private miners in the coming period.
Method 2: Public Miners MW Pipeline to Predict the Network Hashrate
Under the MW-based scenario, we derived a hashrate prediction at 1 693 EH by the end of 2026. It translates to a network hashrate gain of 637 EH in 2026 against 290 EH in 2025. Although efficiency gains and ASIC prices decline are positive signals for miners, the ongoing HPC conversion will actually slow down the hashrate uptrend by swallowing up all the public miner remaining power capacity.
Based on the public miners’ pipeline, we estimate that they will energize a net 1.5 GW of fresh mining racks in 2026, down from 2.2 GW in 2025 and 2.7 GW in 2024. In stark contrast, private miners could energize 3.6 GW, roughly 2.5 times the total pubcos pipeline. This divergence between public and private miners comes from the HPC conversion of most of the U.S. mega-mines (>150MW), whereas private companies are expanding their fleet to cut costs amid a compressed hashprice environment and leverage on Pubcos retirement.
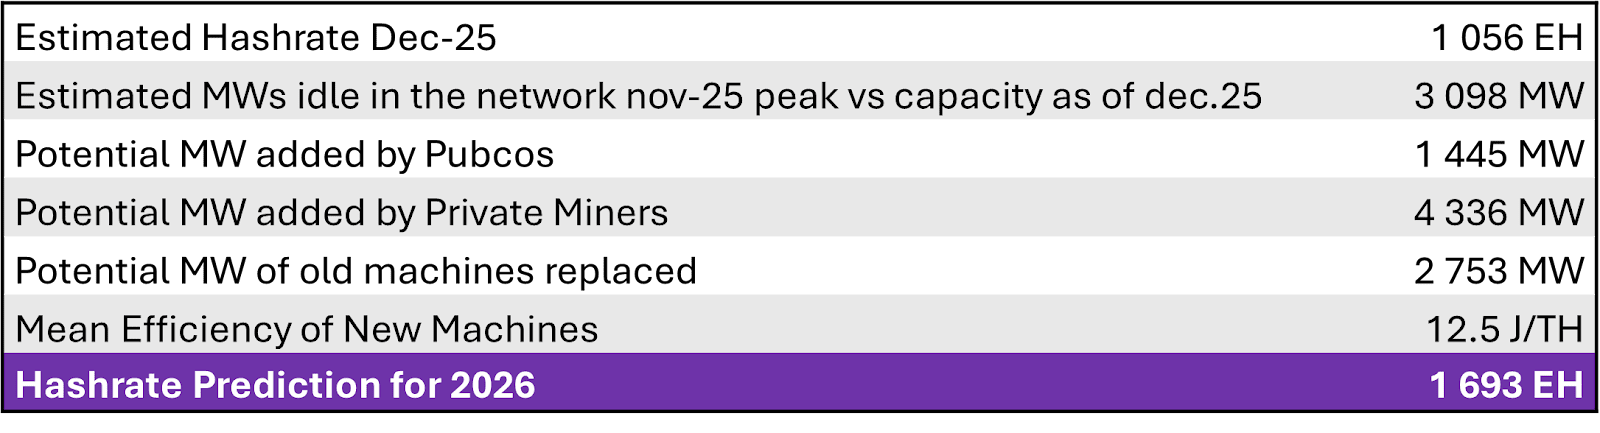
In total, 5.0 GW of new power capacity could come online in 2026, assuming a mean efficiency of 12.5 J/TH for those fresh mining rigs, corresponding to 405 EH of additional hashrate. Moreover, 12.5% of existing machines averaging 27.5 J/TH could be replaced at the same efficiency assumption, contributing an additional 120 EH, bringing the 2026 hashrate gain to a staggering 637 EH – excluding idle capacity of roughly 112 EH, reflecting the difference from current capacity at 22.3 GW (as of 31.12.25) to peak network capacity of 25.1 GW in November 2025.
Method 3: Hashrate Forecast Based on Economics
While previous methods adopt a bottom-up perspective, economics is a top-down methodology leveraging a set of network and market variables to project the future hashrate.
Culminating at 1 731 EH, up by +63.9% from current level – 1 056 EH as of December 2025, this estimate relies on multiple factors listed below:
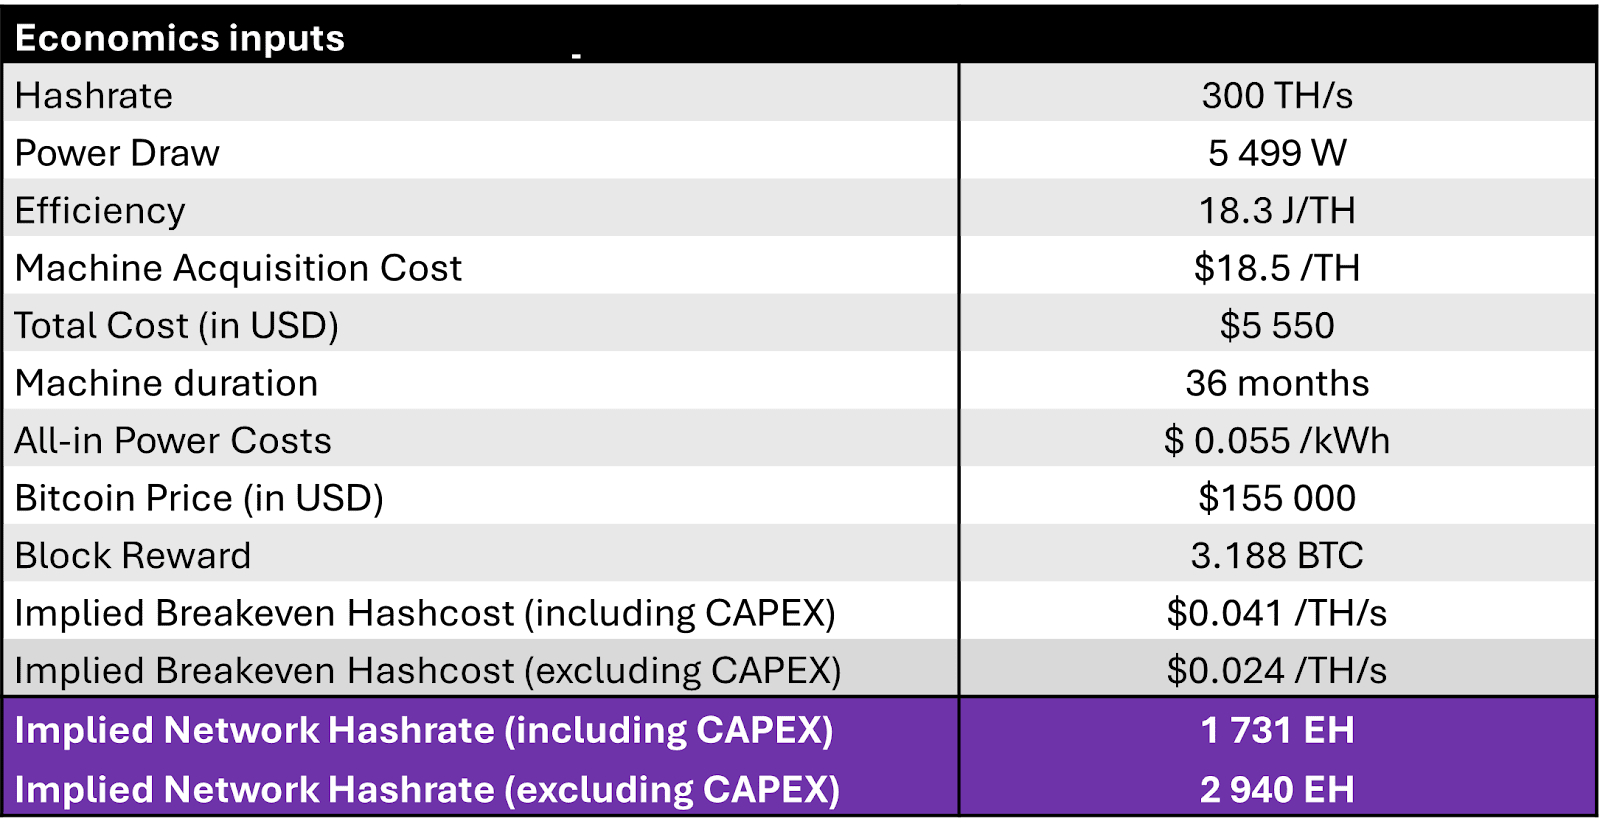
Under this scope, we compute the daily hashcost based on the machine lifespan, performance, acquisition price and power cost. Our assumptions underscore market, network and global environment expectations for 2026.
The daily hashcost is used as a breakeven threshold to derive a theorical network hashrate based on BTC price and block reward assumptions. From another perspective, it reflects the mean hashprice level at which machines can profitably stay online.

