Report
&
March 9, 2026
Understanding how Bitcoin transaction fees are distributed — and why they matter for miners.
If you’re a Bitcoin user checking the mempool, you might notice you only need to pay a fee of 0.3 sat/vB to get your transaction confirmed. You’re happy — but maybe also slightly uneasy. After all, low fees often mean that no one else wants to transact, which isn’t a great sign for Bitcoin activity.
If you’re a miner, you look at your rewards and see 3.125 BTC from the block subsidy and just 0.01 BTC in fees. You start wondering how you’ll survive the next halving if this continues.
And if you’re a financial analyst building a mining model, you might optimistically tweak every other assumption — but for Bitcoin transaction fees, you still plug in 0.01 BTC per block for the next ten years, simply because that’s what you see today.
In this article, we’ll look at how Bitcoin transaction fees are actually distributed — and why today’s low averages don’t tell the whole story. Fees are indeed very low right now, but they’re also extremely unevenly distributed. A few blocks capture a disproportionate share of all fees, and when they appear, they can drastically lift the average.
So, before you assume that today’s low-fee environment will last forever, let’s look at the data.
Let’s start by looking at how low fees really are today.
As you can see on the chart below, the average fee per block this year has been just 0.036 BTC — the lowest level since 2010, Bitcoin’s first full year of existence.
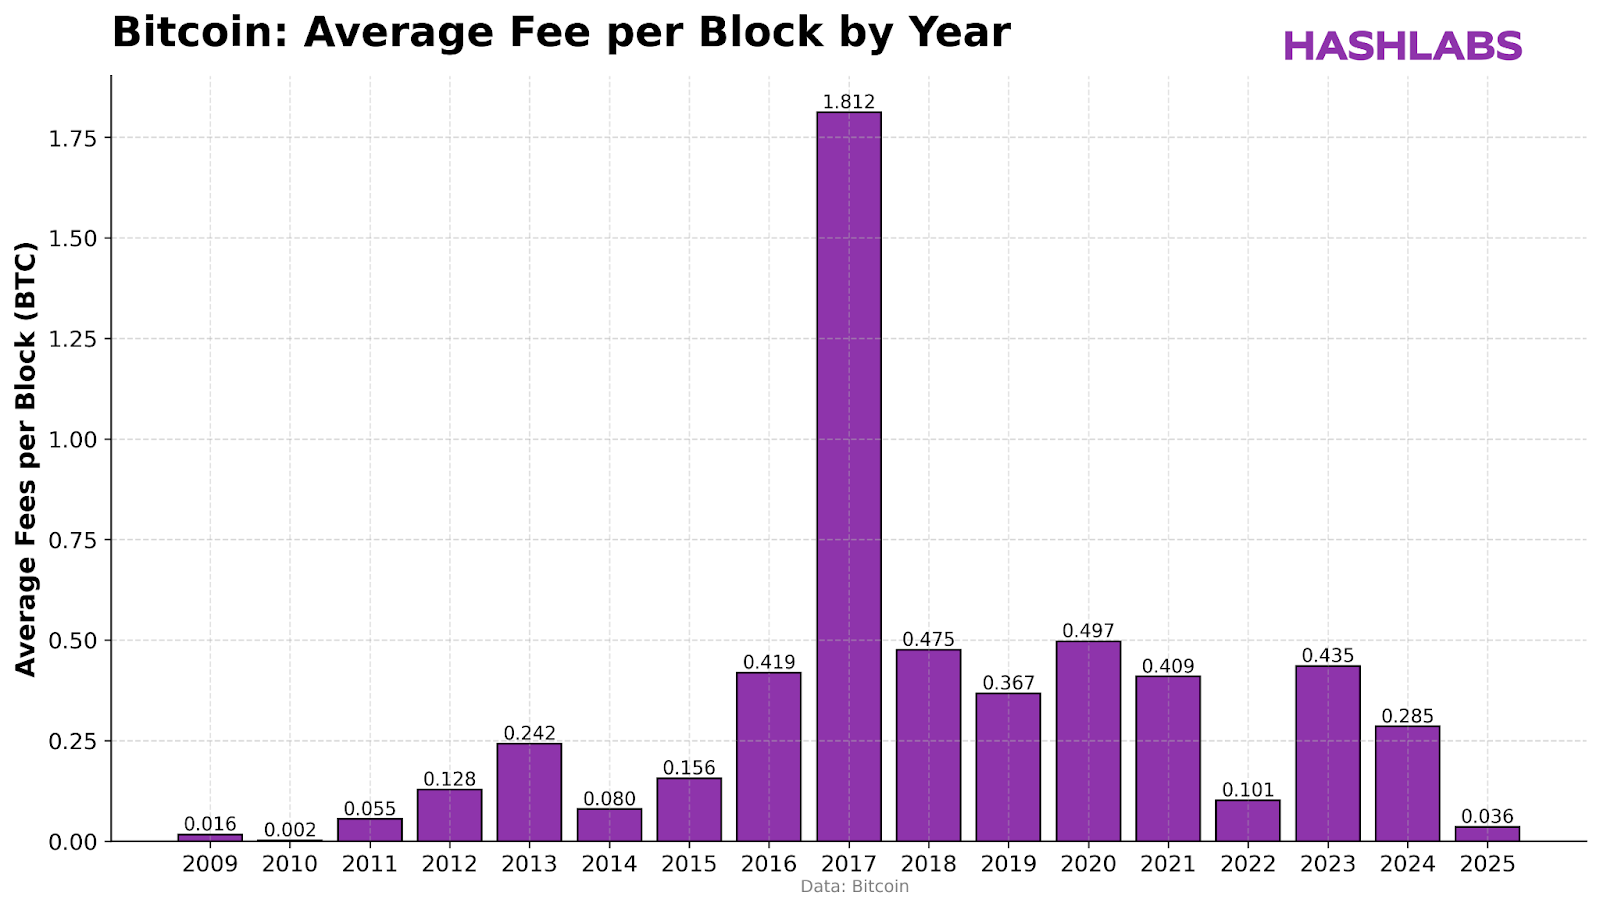
However, as we’ll see, the fact that fees are low most of the time doesn’t mean they’ll remain low in the future.
For more context on fee behavior and its implications, see our earlier article, Are Bitcoin Transaction Fees Too Low? What Miners Should Expect.
Fees have been minimal in 2025 for two reasons. First, base fees on “normal” days have been unusually low, providing miners with almost no additional revenue. Second, we haven’t seen the wild surges that occur when spikes in demand outpace Bitcoin’s limited block space.
The chart below shows the distribution of fees per block since the 2020 halving. It’s a fat-tailed distribution: almost all blocks contain less than 1 BTC in fees, while a few outliers reach beyond 5 BTC — showing how a tiny fraction of blocks capture a disproportionate share of total fees.
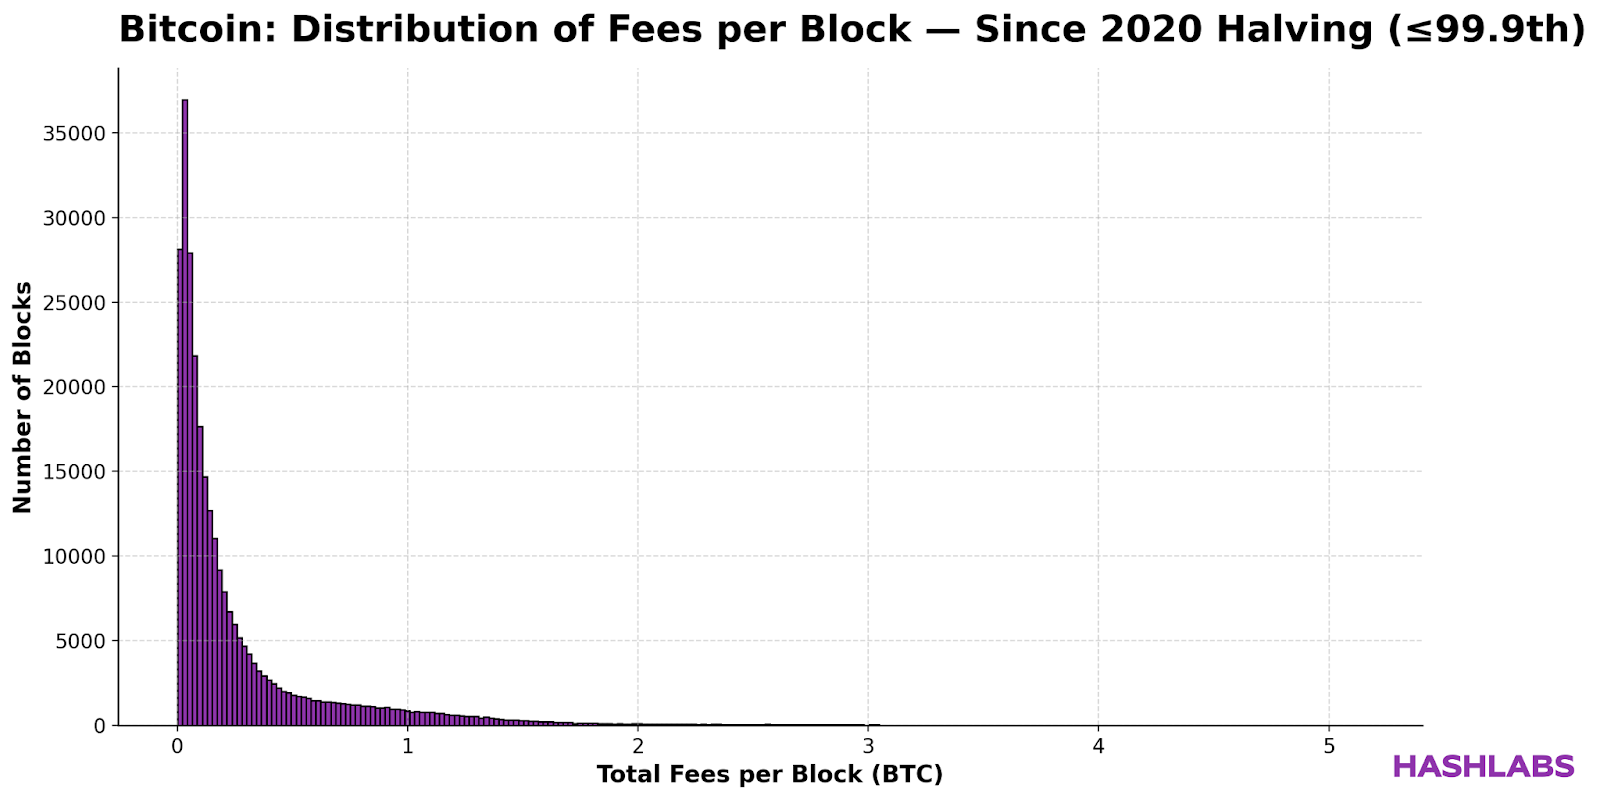
In 2025, we simply haven’t seen many of these high-fee blocks—which explains why overall fees have remained so low.
Most of the time, nothing happens. Then, once in a while, something massive happens that dominates the averages. That’s how Bitcoin transaction fees behave.
If you want to understand how volatility like this affects mining profitability, check out Cost-to-Revenue Ratio: The Financial Risk Metric for Bitcoin Miners.
Next, let’s examine how unevenly fees are actually distributed.
You’ve probably heard of the Pareto principle, or 80/20 rule — a concept that explains how a small share often produces most of the results.
An extreme version of this plays out in Bitcoin’s transaction fee distribution.
The chart below illustrates how cumulative fees are distributed among blocks. The x-axis shows the cumulative percentage of blocks (sorted by fee size), while the y-axis shows the cumulative percentage of total fees.
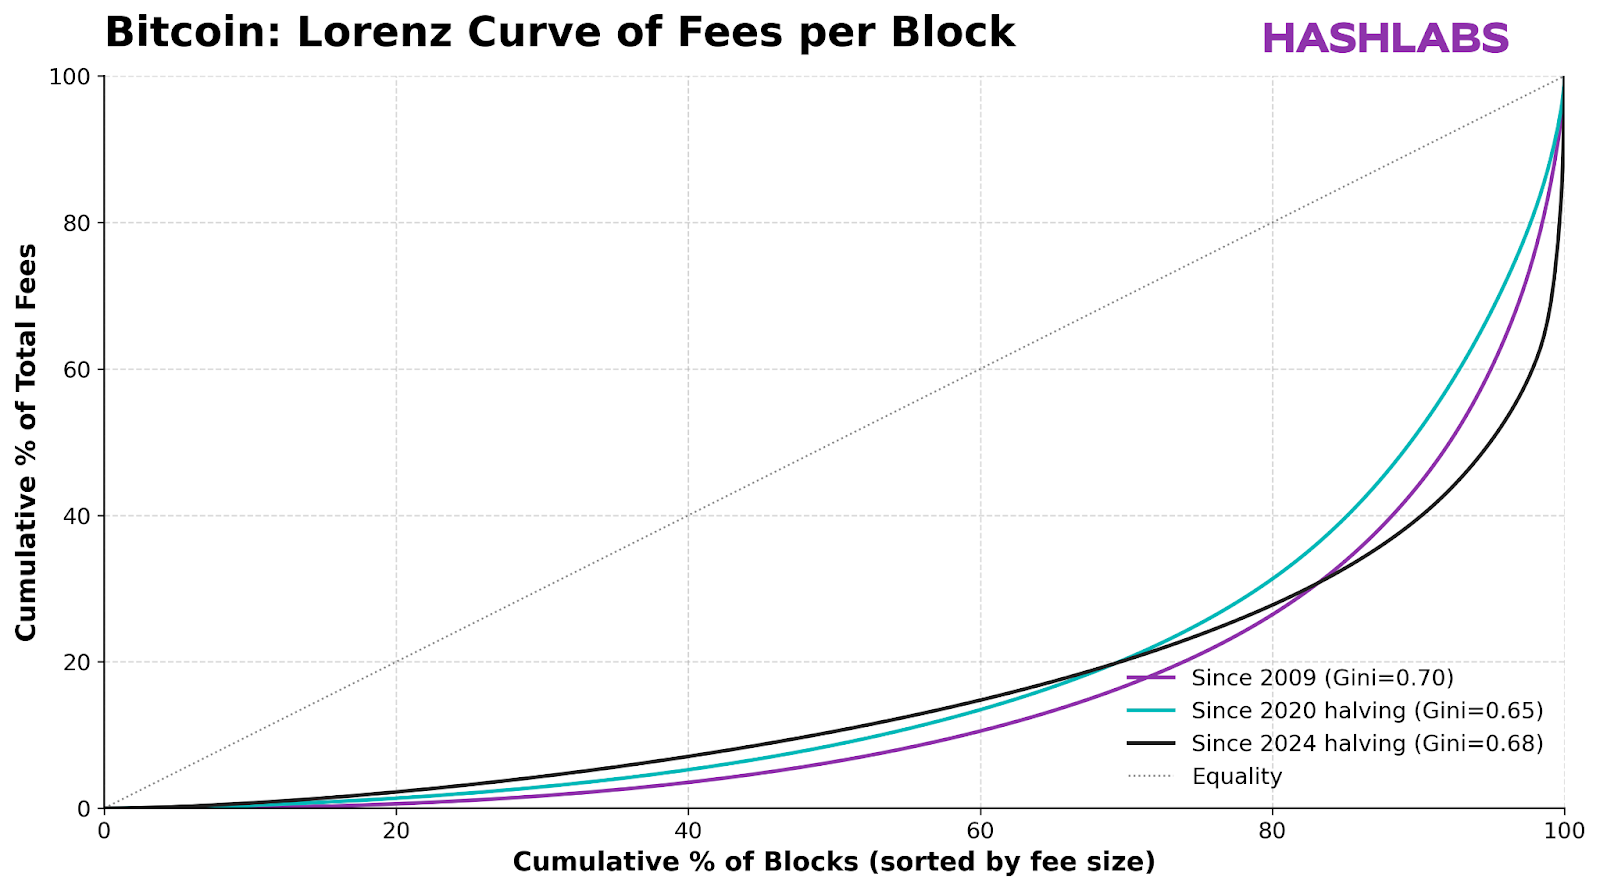
As you can see, the distribution of fees is extremely uneven. If it were equal, the curve would follow the diagonal “equality line” — but in reality, it’s heavily skewed toward a small number of high-fee blocks.
Since the 2024 halving, the top 1% of blocks have collected 32% of all transaction fees, while the top 80% have accounted for 98% of the total. In other words, the vast majority of blocks contain almost no fees at all — while a small handful capture an enormous share of the total.
Bitcoin: Cumulative percentage of total fees in top fee blocks
.png)
Interestingly, this inequality has intensified since the 2024 halving, as fees have remained low most of the time, punctuated by short but explosive surges.
To quantify this inequality, we can use the Gini coefficient, a measure often applied to income distribution. Bitcoin’s fee distribution has a Gini coefficient of 0.68 — roughly comparable to the income inequality of the world’s most unequal countries. In other words, a few lucky blocks make most of the money.
So what does this mean for miners in practice?
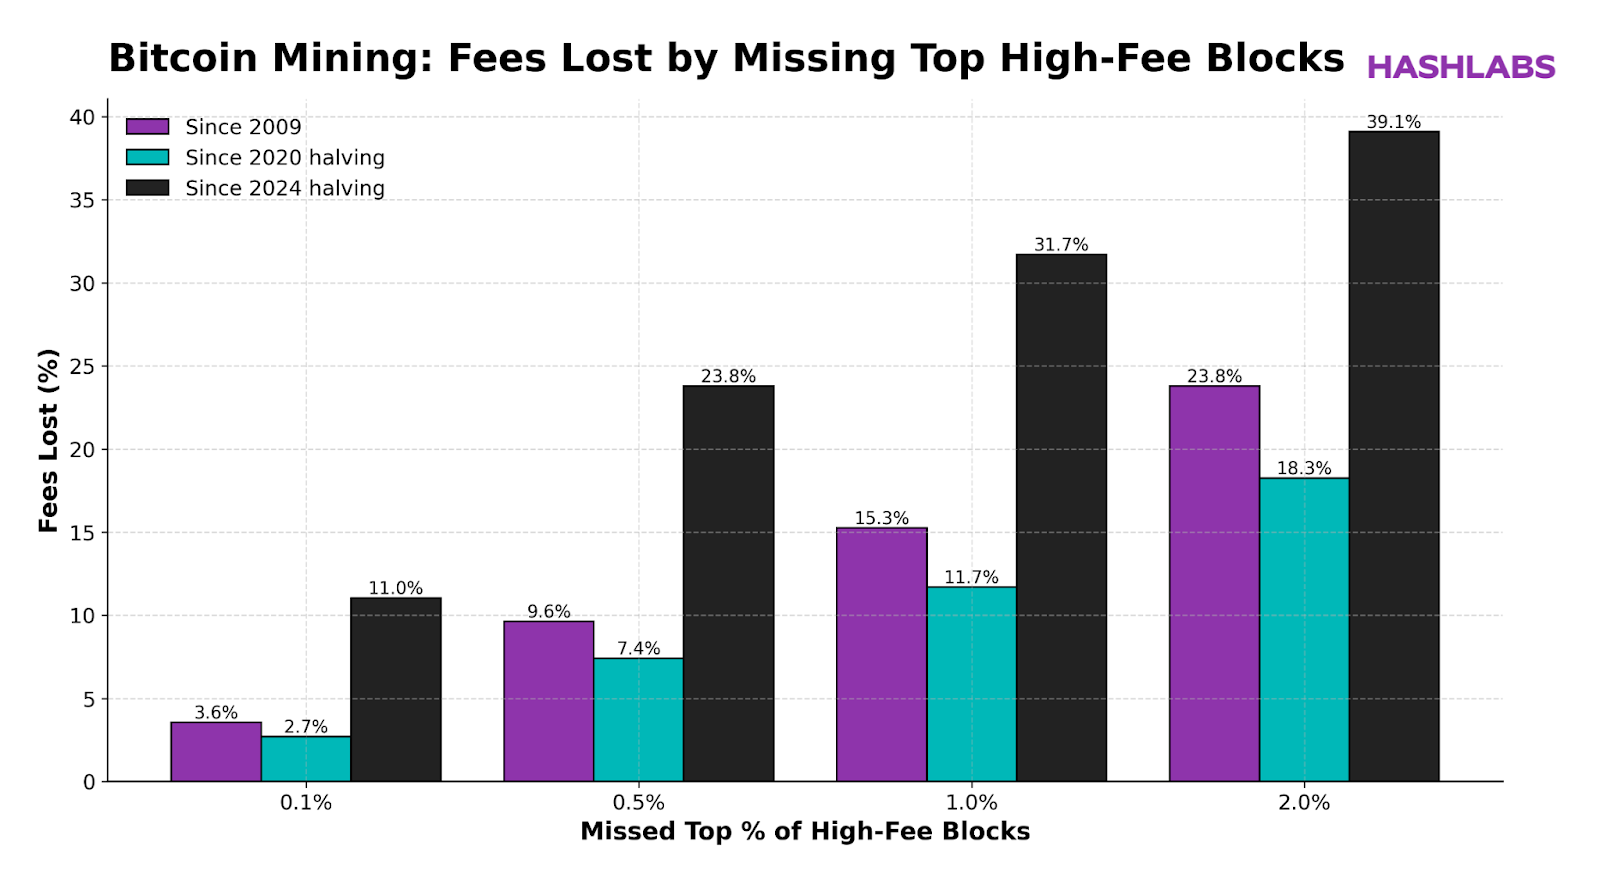
In the previous section, we showed how a small share of blocks captures a large portion of all transaction fees. The charts below build on that idea.
For miners, this concentration has clear implications: missing the top fee blocks means missing out on a large share of potential revenue.
If you had missed just 1% of the highest-fee blocks since the 2024 halving, your total fee income would have been 32% lower — a staggering level of concentration.
You might think, “Fees are so low right now — why should I care?” That’s fair today, but ignoring fees now means trouble later. After the 2028 halving, fees will make up a much larger share of miner revenue, and missing even a few top blocks could be devastating.
The next chart shows the percentage of total revenue lost when missing the highest-fee blocks. It looks modest now because most income still comes from the 3.125 BTC subsidy (to be halved to 1.5625 BTC in 2028).
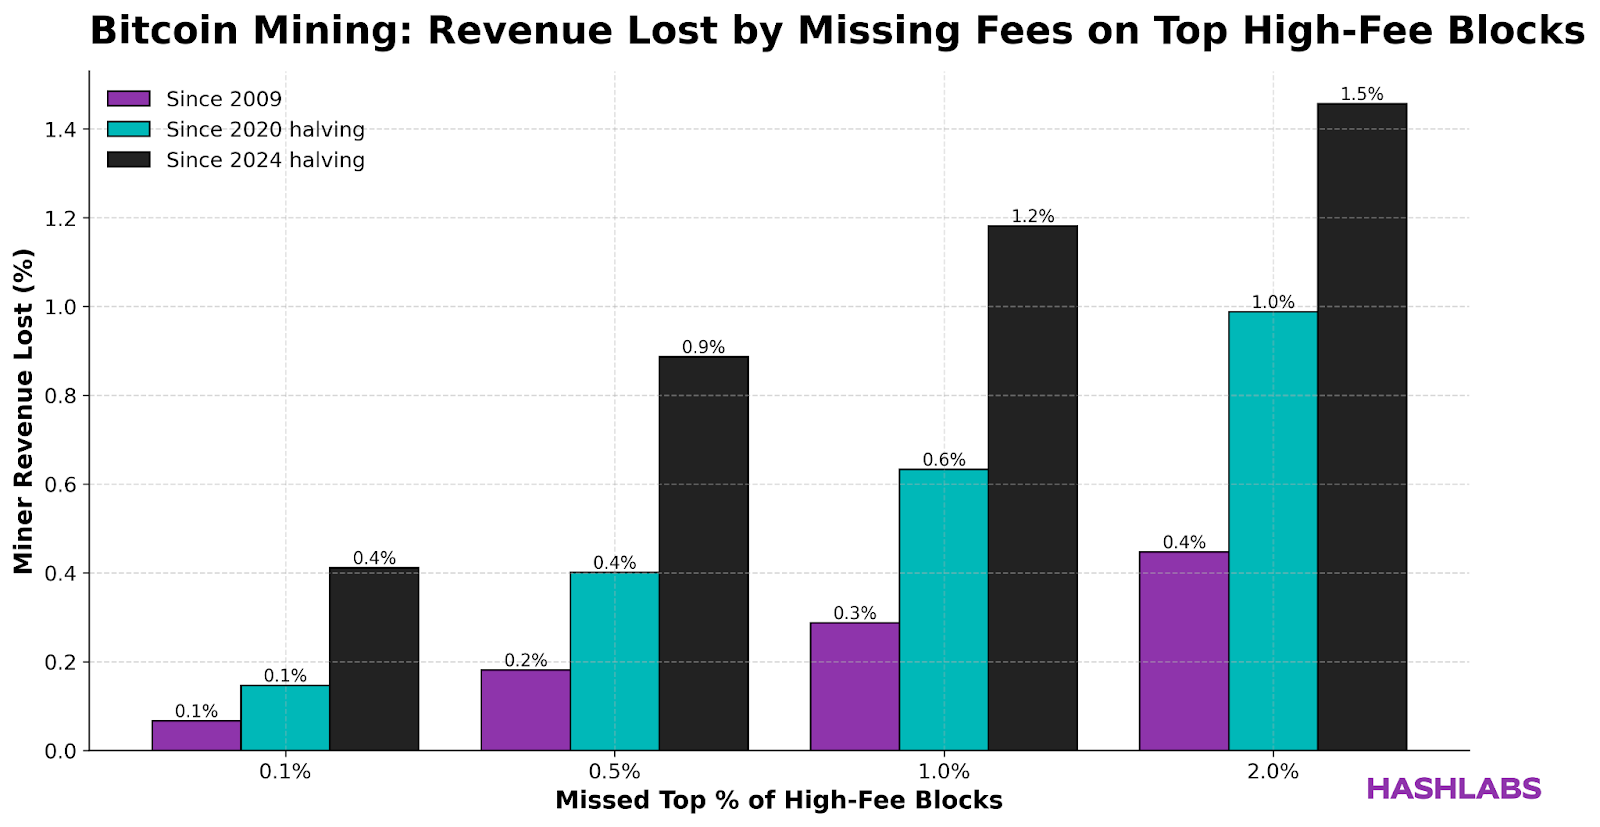
As shown in the chart, if you had missed the top 1% of fee blocks since the 2024 halving, your total revenue would have been reduced by 1.2%. That might not sound like much, but as explained earlier, this figure will grow significantly as the block subsidy declines in future halvings.
If you had missed the top 1% of fee blocks since the 2024 halving, your total revenue would have been 1.2% lower. That may sound minor, but as subsidies decline, the impact will grow dramatically.
Your actual earnings also depend on your mining pool. Some pools may not pass through short-lived fee spikes — which often account for a large share of total fees. To reduce this risk, we generally recommend avoiding FPPS pools in favor of PPLNS pools or a hashrate marketplace, where payouts better reflect true rewards.
We’ll explore how to maximize miner revenue through better pool selection in a future article.
Bitcoin transaction fees follow a fat-tailed pattern — most blocks bring almost nothing, and a few bring enormous rewards. Using current averages to model the future is misleading.
As block subsidies continue to halve, transaction fees will become the cornerstone of miner revenue. Missing the top blocks — or relying on the wrong assumptions — could mean the difference between profitability and loss.
For miners, analysts, and anyone serious about Bitcoin’s future, now is the time to understand and prepare for this transition.
For more insights on bitcoin mining, subscribe to the Hashlabs Newsletter below or explore our latest analyses on the Hashlabs Blog.