Cost-to-Revenue Ratio: The Financial Risk Metric for Bitcoin Miners
The cost-to-revenue ratio — daily operating cost divided by daily mining revenue — is the most important financial risk metric for a Bitcoin miner. At 0.60, 60% of revenue goes to costs; the closer the ratio gets to 1.00, the closer the machine is to mining at a loss. Efficient hardware can beat cheap electricity: an S21 XP in Norway runs a lower ratio than less efficient machines on cheaper power.
Yesterday, I spoke with one of our customers who hosts Bitcoin miners with us in Ethiopia, Norway, and Finland.
Our customer mentioned that the cost-to-revenue ratio of his machines differed significantly between the three locations — a simple but powerful observation.
That single number captures the financial resilience of a mining operation.
In this article, I’ll explain what the cost-to-revenue ratio is, how to calculate it, and why it’s the most important financial risk metric for Bitcoin miners.
What the cost-to-revenue ratio shows
The cost-to-revenue ratio (CRR) measures the relationship between your machine’s operating costs and its mining revenue.
It’s calculated as: Cost-to-Revenue Ratio = Daily Cost ÷ Daily Revenue
For example, if your S21 generates $10 in daily revenue and your operating cost (hosting) is $6, then: 6 ÷ 10 = 0.60
That means 60% of your revenue goes toward operating expenses, leaving a 40% gross margin.
The closer this ratio gets to 100%, the closer your miner is to being cash flow negative.
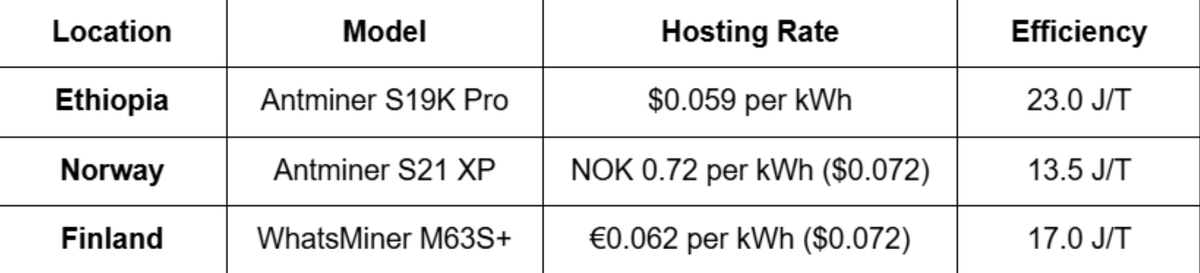
Comparing Hashlabs’ mining sites: Ethiopia, Finland, and Norway
Our customer’s quick comparison clearly showed how differences in hosting rates and machine models shape the cost-to-revenue ratio.
This customer is a diversified miner — a very thoughtful one.
He operates machines in three countries: Ethiopia, Finland, and Norway, and runs three different machine models, giving his fleet both geographical and technical diversification.
Here’s a summary of his fleet:
The chart below shows how their cost-to-revenue ratios compare.
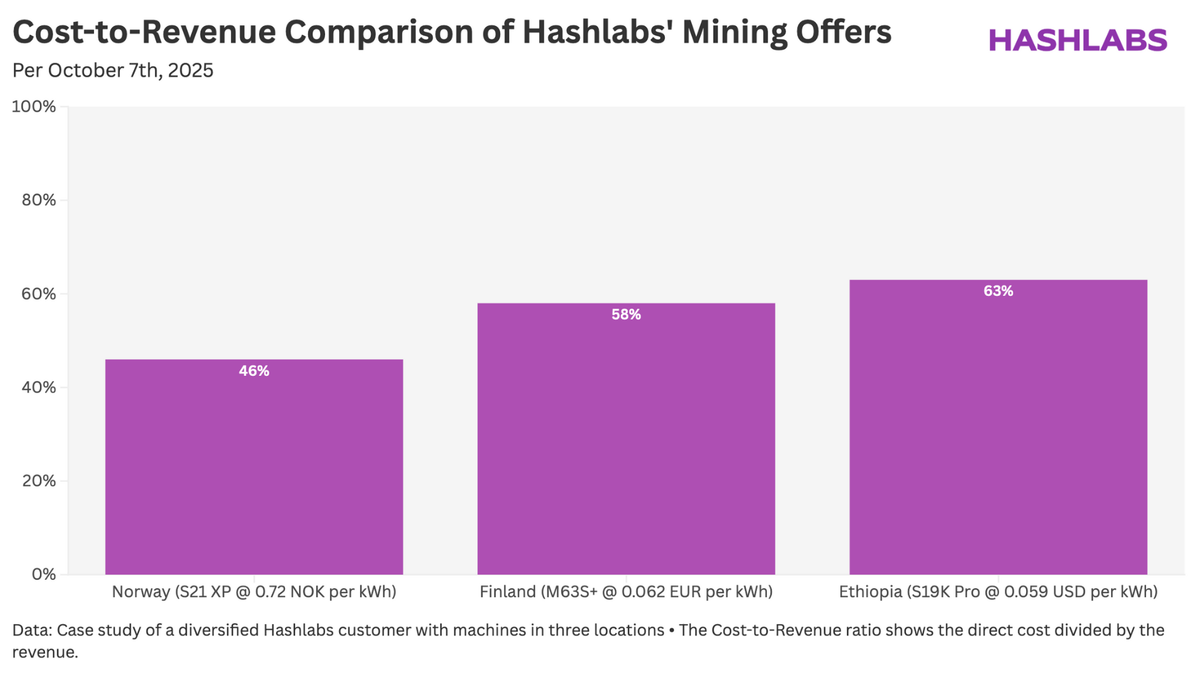
We will now explain the findings from the chart country by country.
Norway — the most efficient setup
The Antminer S21 XP hosted in Norway at 0.72 NOK ($0.072) per kWh has the lowest cost-to-revenue ratio of 46%.
That’s impressive — especially given that Norway is one of Hashlabs’ more expensive hosting locations.
The reason? Efficiency.
The S21 XP is an exceptionally efficient machine, generating high revenue relative to its power consumption.
Even though electricity costs more, its energy-to-revenue conversion is so good that the overall ratio remains low.
Finland — solid balance between cost and efficiency
The WhatsMiner M63S+ in Finland operates at roughly the same USD hosting rate as Norway, yet its cost-to-revenue ratio is higher, around the mid-50s.
That’s because the M63S+ is slightly less efficient than the S21 XP.
Still, Finland remains a strong performer, with high uptime, stability, and a competitive efficiency-to-cost balance.
Ethiopia — highest ratio, fastest payback
In Ethiopia, the customer uses the Antminer S19K Pro hosted at $0.059/kWh.
Despite the lowest power price, this setup has the highest cost-to-revenue ratio at 63%.
The reason is straightforward: the S19K Pro, at 23 J/T, is about 70% less efficient than the S21 XP in Norway.
That massive efficiency gap explains why the Ethiopian setup — despite cheap power — ends up with a higher CRR.
However, Ethiopia also offers the shortest potential payback period, since older and less efficient machines like the S19K Pro are much cheaper to acquire.
For miners willing to accept higher financial risk in exchange for faster payback, this can still be an attractive trade-off.
Key takeaway: two forces determine your CRR
The cost-to-revenue ratio depends on two main factors:
Machine efficiency — how many joules per terahash your machine consumes.
Hosting rate — your cost of power and infrastructure.
To minimize your CRR, you ideally want the most efficient machine at the lowest possible hosting rate.
However, when looking at return on investment — which we often measure by payback period — it’s not always optimal to chase maximum efficiency.
Highly efficient machines are expensive, so their payback periods can be long.
Cheaper, less efficient machines can offer faster payback, but with higher CRRs and greater exposure to market downturns.
The ideal approach is to find a balance between efficiency and cost that fits your risk appetite and investment horizon.
Final thoughts
The cost-to-revenue ratio doesn’t capture every risk — it won’t reflect regulatory, counterparty, or operational issues.
But it remains the core financial risk metric for miners, quantifying exactly how far you are from becoming cash flow negative.
Used across industries for decades — from factories to power plants — it’s the simplest and most effective way to measure financial resilience in Bitcoin mining.
Profitability comes and goes, but resilience keeps you alive.
Every miner should know their cost-to-revenue ratio — and manage their operation around it.